Bipolaris zeicola 26-R-13
Taxonomy: cellular organisms; Eukaryota; Opisthokonta; Fungi; Dikarya; Ascomycota; saccharomyceta; Pezizomycotina; leotiomyceta; dothideomyceta; Dothideomycetes; Pleosporomycetidae; Pleosporales; Pleosporineae; Pleosporaceae; Bipolaris; Bipolaris zeicola
Average proteome isoelectric point is 6.78
Get precalculated fractions of proteins

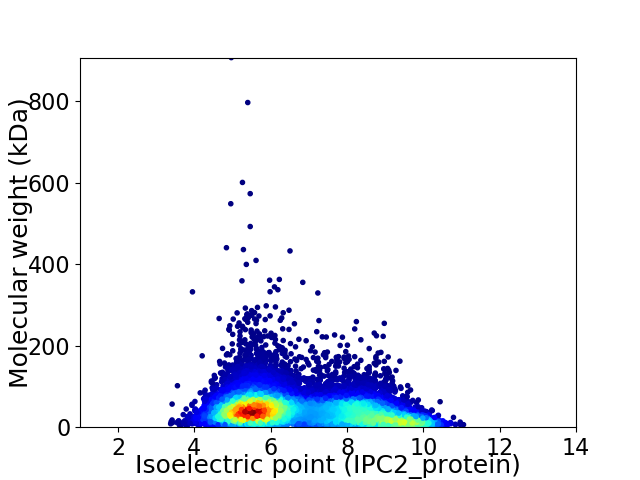
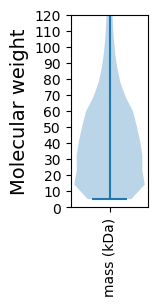
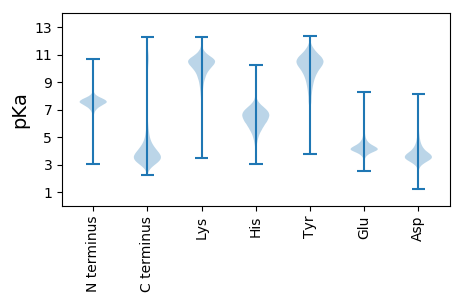
Virtual 2D-PAGE plot for 12851 proteins (isoelectric point calculated using IPC2_protein)
Get csv file with sequences according to given criteria:
* You can choose from 21 different methods for calculating isoelectric point
Summary statistics related to proteome-wise predictions


Protein with the lowest isoelectric point:
>tr|W6XSB4|W6XSB4_COCCA 18S rRNA factor 2 OS=Bipolaris zeicola 26-R-13 OX=930089 GN=COCCADRAFT_40951 PE=3 SV=1
MM1 pKa = 7.35SVTHH5 pKa = 7.13IIYY8 pKa = 9.9YY9 pKa = 9.77NCGHH13 pKa = 6.99LRR15 pKa = 11.84LIVSHH20 pKa = 6.48KK21 pKa = 10.2HH22 pKa = 6.95DD23 pKa = 4.42GDD25 pKa = 3.74EE26 pKa = 5.14CPTNMPDD33 pKa = 3.21TTTTPEE39 pKa = 3.61NCNRR43 pKa = 11.84CMSPKK48 pKa = 10.26SGSDD52 pKa = 3.5SEE54 pKa = 4.68GASPDD59 pKa = 3.3MYY61 pKa = 10.88FEE63 pKa = 5.37SDD65 pKa = 3.42FSSISVSSGDD75 pKa = 4.18ATDD78 pKa = 3.43SDD80 pKa = 4.87YY81 pKa = 11.9NGDD84 pKa = 4.89DD85 pKa = 3.99EE86 pKa = 7.46DD87 pKa = 6.64DD88 pKa = 5.07DD89 pKa = 6.32GSDD92 pKa = 5.39DD93 pKa = 3.79EE94 pKa = 4.85GTDD97 pKa = 3.51EE98 pKa = 5.24GAHH101 pKa = 5.75QSDD104 pKa = 4.18EE105 pKa = 4.3EE106 pKa = 4.18MLSDD110 pKa = 4.63NSNDD114 pKa = 3.34VPALRR119 pKa = 11.84LRR121 pKa = 11.84NVNPTEE127 pKa = 3.92NCTNPWSDD135 pKa = 3.05MSEE138 pKa = 3.95LL139 pKa = 3.76
MM1 pKa = 7.35SVTHH5 pKa = 7.13IIYY8 pKa = 9.9YY9 pKa = 9.77NCGHH13 pKa = 6.99LRR15 pKa = 11.84LIVSHH20 pKa = 6.48KK21 pKa = 10.2HH22 pKa = 6.95DD23 pKa = 4.42GDD25 pKa = 3.74EE26 pKa = 5.14CPTNMPDD33 pKa = 3.21TTTTPEE39 pKa = 3.61NCNRR43 pKa = 11.84CMSPKK48 pKa = 10.26SGSDD52 pKa = 3.5SEE54 pKa = 4.68GASPDD59 pKa = 3.3MYY61 pKa = 10.88FEE63 pKa = 5.37SDD65 pKa = 3.42FSSISVSSGDD75 pKa = 4.18ATDD78 pKa = 3.43SDD80 pKa = 4.87YY81 pKa = 11.9NGDD84 pKa = 4.89DD85 pKa = 3.99EE86 pKa = 7.46DD87 pKa = 6.64DD88 pKa = 5.07DD89 pKa = 6.32GSDD92 pKa = 5.39DD93 pKa = 3.79EE94 pKa = 4.85GTDD97 pKa = 3.51EE98 pKa = 5.24GAHH101 pKa = 5.75QSDD104 pKa = 4.18EE105 pKa = 4.3EE106 pKa = 4.18MLSDD110 pKa = 4.63NSNDD114 pKa = 3.34VPALRR119 pKa = 11.84LRR121 pKa = 11.84NVNPTEE127 pKa = 3.92NCTNPWSDD135 pKa = 3.05MSEE138 pKa = 3.95LL139 pKa = 3.76
Molecular weight: 15.2 kDa
Isoelectric point according different methods:
Protein with the highest isoelectric point:
>tr|W6XNT0|W6XNT0_COCCA F-box domain-containing protein OS=Bipolaris zeicola 26-R-13 OX=930089 GN=COCCADRAFT_107717 PE=3 SV=1
MM1 pKa = 7.53PLARR5 pKa = 11.84RR6 pKa = 11.84SAPRR10 pKa = 11.84TTRR13 pKa = 11.84TTARR17 pKa = 11.84PSLKK21 pKa = 8.96TRR23 pKa = 11.84LMGGRR28 pKa = 11.84KK29 pKa = 7.34TRR31 pKa = 11.84THH33 pKa = 6.09TKK35 pKa = 9.63RR36 pKa = 11.84APAGTTTTTTTTRR49 pKa = 11.84TTRR52 pKa = 11.84TTGGHH57 pKa = 6.59HH58 pKa = 5.97GHH60 pKa = 7.37AAPVHH65 pKa = 4.63HH66 pKa = 7.34HH67 pKa = 6.34KK68 pKa = 10.63RR69 pKa = 11.84HH70 pKa = 4.81ATMGDD75 pKa = 3.45KK76 pKa = 10.91VSGMMMKK83 pKa = 10.48LRR85 pKa = 11.84GSLTRR90 pKa = 11.84RR91 pKa = 11.84PGLKK95 pKa = 10.1AAGTRR100 pKa = 11.84RR101 pKa = 11.84MHH103 pKa = 5.92GTDD106 pKa = 2.72GRR108 pKa = 11.84NARR111 pKa = 11.84RR112 pKa = 11.84VYY114 pKa = 10.89
MM1 pKa = 7.53PLARR5 pKa = 11.84RR6 pKa = 11.84SAPRR10 pKa = 11.84TTRR13 pKa = 11.84TTARR17 pKa = 11.84PSLKK21 pKa = 8.96TRR23 pKa = 11.84LMGGRR28 pKa = 11.84KK29 pKa = 7.34TRR31 pKa = 11.84THH33 pKa = 6.09TKK35 pKa = 9.63RR36 pKa = 11.84APAGTTTTTTTTRR49 pKa = 11.84TTRR52 pKa = 11.84TTGGHH57 pKa = 6.59HH58 pKa = 5.97GHH60 pKa = 7.37AAPVHH65 pKa = 4.63HH66 pKa = 7.34HH67 pKa = 6.34KK68 pKa = 10.63RR69 pKa = 11.84HH70 pKa = 4.81ATMGDD75 pKa = 3.45KK76 pKa = 10.91VSGMMMKK83 pKa = 10.48LRR85 pKa = 11.84GSLTRR90 pKa = 11.84RR91 pKa = 11.84PGLKK95 pKa = 10.1AAGTRR100 pKa = 11.84RR101 pKa = 11.84MHH103 pKa = 5.92GTDD106 pKa = 2.72GRR108 pKa = 11.84NARR111 pKa = 11.84RR112 pKa = 11.84VYY114 pKa = 10.89
Molecular weight: 12.56 kDa
Isoelectric point according different methods:
Peptides (in silico digests for buttom-up proteomics)
Below you can find in silico digests of the whole proteome with Trypsin, Chymotrypsin, Trypsin+LysC, LysN, ArgC proteases suitable for different mass spec machines.| Try ESI |
 |
|---|
| ChTry ESI |
 |
|---|
| ArgC ESI |
 |
|---|
| LysN ESI |
 |
|---|
| TryLysC ESI |
 |
|---|
| Try MALDI |
 |
|---|
| ChTry MALDI |
 |
|---|
| ArgC MALDI |
 |
|---|
| LysN MALDI |
 |
|---|
| TryLysC MALDI |
 |
|---|
| Try LTQ |
 |
|---|
| ChTry LTQ |
 |
|---|
| ArgC LTQ |
 |
|---|
| LysN LTQ |
 |
|---|
| TryLysC LTQ |
 |
|---|
| Try MSlow |
 |
|---|
| ChTry MSlow |
 |
|---|
| ArgC MSlow |
 |
|---|
| LysN MSlow |
 |
|---|
| TryLysC MSlow |
 |
|---|
| Try MShigh |
 |
|---|
| ChTry MShigh |
 |
|---|
| ArgC MShigh |
 |
|---|
| LysN MShigh |
 |
|---|
| TryLysC MShigh |
 |
|---|
General Statistics
Number of major isoforms |
Number of additional isoforms |
Number of all proteins |
Number of amino acids |
Min. Seq. Length |
Max. Seq. Length |
Avg. Seq. Length |
Avg. Mol. Weight |
|---|---|---|---|---|---|---|---|
0 |
5498859 |
49 |
8312 |
427.9 |
47.39 |
Amino acid frequency
Ala |
Cys |
Asp |
Glu |
Phe |
Gly |
His |
Ile |
Lys |
Leu |
|---|---|---|---|---|---|---|---|---|---|
8.731 ± 0.021 | 1.302 ± 0.01 |
5.566 ± 0.015 | 6.08 ± 0.024 |
3.671 ± 0.013 | 6.73 ± 0.021 |
2.477 ± 0.011 | 4.897 ± 0.017 |
5.082 ± 0.021 | 8.638 ± 0.024 |
Met |
Asn |
Gln |
Pro |
Arg |
Ser |
Thr |
Val |
Trp |
Tyr |
|---|---|---|---|---|---|---|---|---|---|
2.239 ± 0.009 | 3.759 ± 0.012 |
6.16 ± 0.025 | 4.144 ± 0.015 |
6.0 ± 0.019 | 8.108 ± 0.027 |
6.08 ± 0.014 | 6.035 ± 0.016 |
1.473 ± 0.008 | 2.829 ± 0.013 |
Most of the basic statistics you can see at this page can be downloaded from this CSV file
Proteome-pI is available under Creative Commons Attribution-NoDerivs license, for more details see here
| Reference: Kozlowski LP. Proteome-pI 2.0: Proteome Isoelectric Point Database Update. Nucleic Acids Res. 2021, doi: 10.1093/nar/gkab944 | Contact: Lukasz P. Kozlowski |
