Phenylobacterium hankyongense
Taxonomy: cellular organisms; Bacteria; Proteobacteria; Alphaproteobacteria; Caulobacterales; Caulobacteraceae; Phenylobacterium
Average proteome isoelectric point is 6.67
Get precalculated fractions of proteins

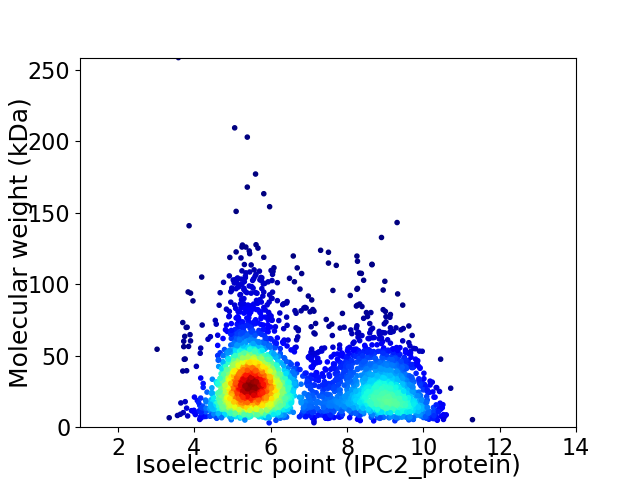
Virtual 2D-PAGE plot for 3638 proteins (isoelectric point calculated using IPC2_protein)
Get csv file with sequences according to given criteria:
* You can choose from 21 different methods for calculating isoelectric point
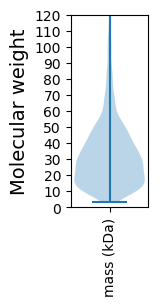
Summary statistics related to proteome-wise predictions


Protein with the lowest isoelectric point:
>tr|A0A328B3P8|A0A328B3P8_9CAUL GNAT family N-acetyltransferase OS=Phenylobacterium hankyongense OX=1813876 GN=DJ021_11940 PE=4 SV=1
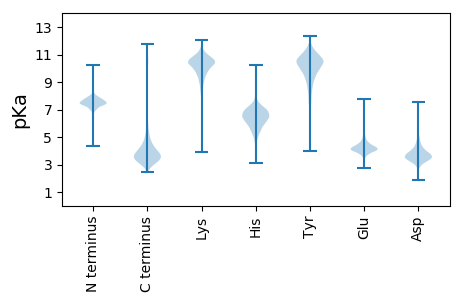
MM1 pKa = 7.31PTLTFDD7 pKa = 3.39TTPAGLFASYY17 pKa = 11.02GEE19 pKa = 4.39SQFTLTTQQATDD31 pKa = 3.32LHH33 pKa = 6.01LTDD36 pKa = 4.42VLWNGGLTSPQGTGGYY52 pKa = 9.87LINEE56 pKa = 4.41YY57 pKa = 10.84SQDD60 pKa = 3.72TVVLKK65 pKa = 10.68YY66 pKa = 10.88SGTTTFGVLSLDD78 pKa = 3.46VNGYY82 pKa = 10.22RR83 pKa = 11.84NAGFDD88 pKa = 3.65ANNNVIPGSSTVSFNFTGVRR108 pKa = 11.84ADD110 pKa = 3.4YY111 pKa = 10.74TEE113 pKa = 3.75VHH115 pKa = 5.69FTFTTDD121 pKa = 3.35AVDD124 pKa = 4.29GFQQVVLPTDD134 pKa = 4.31FATGLTALTWTTTNPVEE151 pKa = 3.85AWGAFDD157 pKa = 4.42NVSLVVDD164 pKa = 4.33TTQAPPPVTPPPVTPPPVNHH184 pKa = 6.92APVAVQDD191 pKa = 3.67VAAATVHH198 pKa = 5.23GTVLINVLGNDD209 pKa = 3.3TDD211 pKa = 4.65ADD213 pKa = 4.15GDD215 pKa = 4.07TLGIAGFGPSASAISASLSAKK236 pKa = 9.74SALGATISFQSGQLLYY252 pKa = 9.62TANAVSFDD260 pKa = 3.42AVAPGHH266 pKa = 6.07SVTDD270 pKa = 3.25TFYY273 pKa = 10.97YY274 pKa = 10.14TVTDD278 pKa = 3.62AAGATSTASVTVTVSSPPPPPAPPPSATGPDD309 pKa = 3.33IVGGNHH315 pKa = 5.62PQVLNGTALGEE326 pKa = 4.22QIFGGNSSDD335 pKa = 3.42VLMGNGGADD344 pKa = 3.29TLHH347 pKa = 6.58GNNGADD353 pKa = 3.95LLYY356 pKa = 11.08GGAGNDD362 pKa = 4.71LLLGDD367 pKa = 4.77NGSDD371 pKa = 4.35LLDD374 pKa = 4.1GGAGNDD380 pKa = 3.59TLTGGNSPDD389 pKa = 3.18AFVFSQHH396 pKa = 6.18FGLDD400 pKa = 3.49TITDD404 pKa = 4.16FDD406 pKa = 4.53SKK408 pKa = 11.62NEE410 pKa = 4.14VITMSRR416 pKa = 11.84STFSSFNDD424 pKa = 3.68LKK426 pKa = 11.32AHH428 pKa = 6.76AVQSGANVVITHH440 pKa = 7.14DD441 pKa = 3.81ADD443 pKa = 3.89EE444 pKa = 4.66VLTLLNVKK452 pKa = 10.34LSALNSGDD460 pKa = 3.47FLFVV464 pKa = 3.11
MM1 pKa = 7.31PTLTFDD7 pKa = 3.39TTPAGLFASYY17 pKa = 11.02GEE19 pKa = 4.39SQFTLTTQQATDD31 pKa = 3.32LHH33 pKa = 6.01LTDD36 pKa = 4.42VLWNGGLTSPQGTGGYY52 pKa = 9.87LINEE56 pKa = 4.41YY57 pKa = 10.84SQDD60 pKa = 3.72TVVLKK65 pKa = 10.68YY66 pKa = 10.88SGTTTFGVLSLDD78 pKa = 3.46VNGYY82 pKa = 10.22RR83 pKa = 11.84NAGFDD88 pKa = 3.65ANNNVIPGSSTVSFNFTGVRR108 pKa = 11.84ADD110 pKa = 3.4YY111 pKa = 10.74TEE113 pKa = 3.75VHH115 pKa = 5.69FTFTTDD121 pKa = 3.35AVDD124 pKa = 4.29GFQQVVLPTDD134 pKa = 4.31FATGLTALTWTTTNPVEE151 pKa = 3.85AWGAFDD157 pKa = 4.42NVSLVVDD164 pKa = 4.33TTQAPPPVTPPPVTPPPVNHH184 pKa = 6.92APVAVQDD191 pKa = 3.67VAAATVHH198 pKa = 5.23GTVLINVLGNDD209 pKa = 3.3TDD211 pKa = 4.65ADD213 pKa = 4.15GDD215 pKa = 4.07TLGIAGFGPSASAISASLSAKK236 pKa = 9.74SALGATISFQSGQLLYY252 pKa = 9.62TANAVSFDD260 pKa = 3.42AVAPGHH266 pKa = 6.07SVTDD270 pKa = 3.25TFYY273 pKa = 10.97YY274 pKa = 10.14TVTDD278 pKa = 3.62AAGATSTASVTVTVSSPPPPPAPPPSATGPDD309 pKa = 3.33IVGGNHH315 pKa = 5.62PQVLNGTALGEE326 pKa = 4.22QIFGGNSSDD335 pKa = 3.42VLMGNGGADD344 pKa = 3.29TLHH347 pKa = 6.58GNNGADD353 pKa = 3.95LLYY356 pKa = 11.08GGAGNDD362 pKa = 4.71LLLGDD367 pKa = 4.77NGSDD371 pKa = 4.35LLDD374 pKa = 4.1GGAGNDD380 pKa = 3.59TLTGGNSPDD389 pKa = 3.18AFVFSQHH396 pKa = 6.18FGLDD400 pKa = 3.49TITDD404 pKa = 4.16FDD406 pKa = 4.53SKK408 pKa = 11.62NEE410 pKa = 4.14VITMSRR416 pKa = 11.84STFSSFNDD424 pKa = 3.68LKK426 pKa = 11.32AHH428 pKa = 6.76AVQSGANVVITHH440 pKa = 7.14DD441 pKa = 3.81ADD443 pKa = 3.89EE444 pKa = 4.66VLTLLNVKK452 pKa = 10.34LSALNSGDD460 pKa = 3.47FLFVV464 pKa = 3.11
Molecular weight: 47.48 kDa
Isoelectric point according different methods:
Protein with the highest isoelectric point:
>tr|A0A328B0B2|A0A328B0B2_9CAUL Pyridoxal phosphate homeostasis protein OS=Phenylobacterium hankyongense OX=1813876 GN=DJ021_05875 PE=3 SV=1
MM1 pKa = 7.45KK2 pKa = 9.56RR3 pKa = 11.84TFQPSRR9 pKa = 11.84LVRR12 pKa = 11.84ARR14 pKa = 11.84RR15 pKa = 11.84HH16 pKa = 4.47GFRR19 pKa = 11.84LRR21 pKa = 11.84MSTKK25 pKa = 10.17NGQKK29 pKa = 9.5VLARR33 pKa = 11.84RR34 pKa = 11.84RR35 pKa = 11.84AKK37 pKa = 9.93GRR39 pKa = 11.84KK40 pKa = 8.85RR41 pKa = 11.84LSAA44 pKa = 3.96
MM1 pKa = 7.45KK2 pKa = 9.56RR3 pKa = 11.84TFQPSRR9 pKa = 11.84LVRR12 pKa = 11.84ARR14 pKa = 11.84RR15 pKa = 11.84HH16 pKa = 4.47GFRR19 pKa = 11.84LRR21 pKa = 11.84MSTKK25 pKa = 10.17NGQKK29 pKa = 9.5VLARR33 pKa = 11.84RR34 pKa = 11.84RR35 pKa = 11.84AKK37 pKa = 9.93GRR39 pKa = 11.84KK40 pKa = 8.85RR41 pKa = 11.84LSAA44 pKa = 3.96
Molecular weight: 5.26 kDa
Isoelectric point according different methods:
Peptides (in silico digests for buttom-up proteomics)
Below you can find in silico digests of the whole proteome with Trypsin, Chymotrypsin, Trypsin+LysC, LysN, ArgC proteases suitable for different mass spec machines.| Try ESI |
 |
|---|
| ChTry ESI |
 |
|---|
| ArgC ESI |
 |
|---|
| LysN ESI |
 |
|---|
| TryLysC ESI |
 |
|---|
| Try MALDI |
 |
|---|
| ChTry MALDI |
 |
|---|
| ArgC MALDI |
 |
|---|
| LysN MALDI |
 |
|---|
| TryLysC MALDI |
 |
|---|
| Try LTQ |
 |
|---|
| ChTry LTQ |
 |
|---|
| ArgC LTQ |
 |
|---|
| LysN LTQ |
 |
|---|
| TryLysC LTQ |
 |
|---|
| Try MSlow |
 |
|---|
| ChTry MSlow |
 |
|---|
| ArgC MSlow |
 |
|---|
| LysN MSlow |
 |
|---|
| TryLysC MSlow |
 |
|---|
| Try MShigh |
 |
|---|
| ChTry MShigh |
 |
|---|
| ArgC MShigh |
 |
|---|
| LysN MShigh |
 |
|---|
| TryLysC MShigh |
 |
|---|
General Statistics
Number of major isoforms |
Number of additional isoforms |
Number of all proteins |
Number of amino acids |
Min. Seq. Length |
Max. Seq. Length |
Avg. Seq. Length |
Avg. Mol. Weight |
|---|---|---|---|---|---|---|---|
0 |
1152277 |
28 |
2560 |
316.7 |
34.02 |
Amino acid frequency
Ala |
Cys |
Asp |
Glu |
Phe |
Gly |
His |
Ile |
Lys |
Leu |
|---|---|---|---|---|---|---|---|---|---|
14.268 ± 0.066 | 0.73 ± 0.012 |
5.669 ± 0.031 | 5.459 ± 0.043 |
3.46 ± 0.022 | 9.085 ± 0.051 |
1.883 ± 0.019 | 4.095 ± 0.029 |
2.895 ± 0.032 | 10.046 ± 0.053 |
Met |
Asn |
Gln |
Pro |
Arg |
Ser |
Thr |
Val |
Trp |
Tyr |
|---|---|---|---|---|---|---|---|---|---|
2.19 ± 0.02 | 2.283 ± 0.026 |
5.758 ± 0.037 | 3.296 ± 0.03 |
7.521 ± 0.052 | 4.919 ± 0.035 |
5.229 ± 0.06 | 7.662 ± 0.034 |
1.369 ± 0.015 | 2.183 ± 0.022 |
Most of the basic statistics you can see at this page can be downloaded from this CSV file
Proteome-pI is available under Creative Commons Attribution-NoDerivs license, for more details see here
| Reference: Kozlowski LP. Proteome-pI 2.0: Proteome Isoelectric Point Database Update. Nucleic Acids Res. 2021, doi: 10.1093/nar/gkab944 | Contact: Lukasz P. Kozlowski |
