Massilia sp. BSC265
Taxonomy: cellular organisms; Bacteria; Proteobacteria; Betaproteobacteria; Burkholderiales; Oxalobacteraceae; Massilia; unclassified Massilia
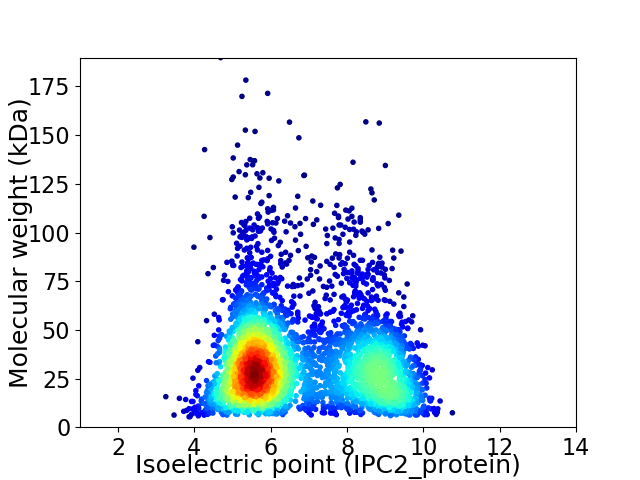
Average proteome isoelectric point is 6.8
Get precalculated fractions of proteins

Virtual 2D-PAGE plot for 4034 proteins (isoelectric point calculated using IPC2_protein)
Get csv file with sequences according to given criteria:
* You can choose from 21 different methods for calculating isoelectric point
Summary statistics related to proteome-wise predictions


Protein with the lowest isoelectric point:
>tr|A0A086WAN5|A0A086WAN5_9BURK Beta-lactamase OS=Massilia sp. BSC265 OX=1549812 GN=JN27_14330 PE=4 SV=1
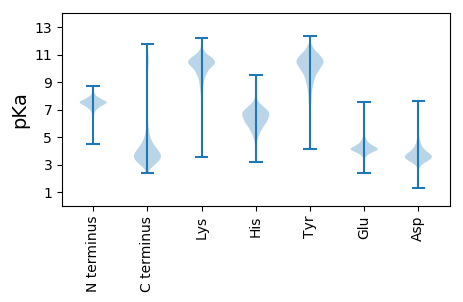
MM1 pKa = 7.25TSSDD5 pKa = 3.34FLLRR9 pKa = 11.84YY10 pKa = 10.0ASVTTALFDD19 pKa = 5.08HH20 pKa = 7.15IEE22 pKa = 4.32HH23 pKa = 7.44DD24 pKa = 4.27MLALSCAFIDD34 pKa = 5.79DD35 pKa = 5.33DD36 pKa = 4.81DD37 pKa = 4.51TPPPAWQDD45 pKa = 3.35ALPPHH50 pKa = 7.19AMQPLGLPQAA60 pKa = 4.4
MM1 pKa = 7.25TSSDD5 pKa = 3.34FLLRR9 pKa = 11.84YY10 pKa = 10.0ASVTTALFDD19 pKa = 5.08HH20 pKa = 7.15IEE22 pKa = 4.32HH23 pKa = 7.44DD24 pKa = 4.27MLALSCAFIDD34 pKa = 5.79DD35 pKa = 5.33DD36 pKa = 4.81DD37 pKa = 4.51TPPPAWQDD45 pKa = 3.35ALPPHH50 pKa = 7.19AMQPLGLPQAA60 pKa = 4.4
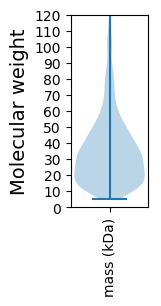
Molecular weight: 6.6 kDa
Isoelectric point according different methods:
Protein with the highest isoelectric point:
>tr|A0A086W9M8|A0A086W9M8_9BURK Uroporphyrin-III methyltransferase OS=Massilia sp. BSC265 OX=1549812 GN=JN27_16070 PE=4 SV=1
MM1 pKa = 7.45NEE3 pKa = 3.44HH4 pKa = 6.29AALRR8 pKa = 11.84RR9 pKa = 11.84DD10 pKa = 4.38RR11 pKa = 11.84NFTWLMSGAVISALGDD27 pKa = 3.56QFSMIALPWLVLQLTGDD44 pKa = 4.02PLALGMMVALMGVPRR59 pKa = 11.84AILILFGGAVVDD71 pKa = 4.79RR72 pKa = 11.84YY73 pKa = 10.54SPKK76 pKa = 10.12RR77 pKa = 11.84VLMLTKK83 pKa = 10.25HH84 pKa = 5.33VNAVLLAILAALVLLGKK101 pKa = 9.1ATLLPVALLAVGLSVASAFSIPAGTSMLPHH131 pKa = 6.56AVAPRR136 pKa = 11.84HH137 pKa = 5.46LAAANAAMMAVRR149 pKa = 11.84QLSLLAGPLLAGLLFVLAGDD169 pKa = 4.84GSRR172 pKa = 11.84GMQDD176 pKa = 2.65AGGLGIAFAVDD187 pKa = 3.59CLSFVLSAWTLSKK200 pKa = 10.57VRR202 pKa = 11.84PRR204 pKa = 11.84VAAEE208 pKa = 3.72ADD210 pKa = 3.24KK211 pKa = 11.12AAAGSVLRR219 pKa = 11.84AVGAGLQALWRR230 pKa = 11.84NPLLRR235 pKa = 11.84TAFLYY240 pKa = 9.85WGLCACVVGGVMQVALPLLASEE262 pKa = 4.7RR263 pKa = 11.84LHH265 pKa = 6.29GASGLALLMGAHH277 pKa = 6.07GTGSLAGMALFGALGRR293 pKa = 11.84RR294 pKa = 11.84RR295 pKa = 11.84VVNLGVTLLLVDD307 pKa = 4.17ALVGVLLLPMGLVTQAWQGVLLLVAIGVLGGFVQVAVFTWIQQCVPQAMLGRR359 pKa = 11.84MMGIFMFVFMGLAPLAAAVAGWLATLLSLASLFAAVGLFLALSAVLAWLFTPMATLTDD417 pKa = 3.94PALPAQHH424 pKa = 6.3QGG426 pKa = 3.06
MM1 pKa = 7.45NEE3 pKa = 3.44HH4 pKa = 6.29AALRR8 pKa = 11.84RR9 pKa = 11.84DD10 pKa = 4.38RR11 pKa = 11.84NFTWLMSGAVISALGDD27 pKa = 3.56QFSMIALPWLVLQLTGDD44 pKa = 4.02PLALGMMVALMGVPRR59 pKa = 11.84AILILFGGAVVDD71 pKa = 4.79RR72 pKa = 11.84YY73 pKa = 10.54SPKK76 pKa = 10.12RR77 pKa = 11.84VLMLTKK83 pKa = 10.25HH84 pKa = 5.33VNAVLLAILAALVLLGKK101 pKa = 9.1ATLLPVALLAVGLSVASAFSIPAGTSMLPHH131 pKa = 6.56AVAPRR136 pKa = 11.84HH137 pKa = 5.46LAAANAAMMAVRR149 pKa = 11.84QLSLLAGPLLAGLLFVLAGDD169 pKa = 4.84GSRR172 pKa = 11.84GMQDD176 pKa = 2.65AGGLGIAFAVDD187 pKa = 3.59CLSFVLSAWTLSKK200 pKa = 10.57VRR202 pKa = 11.84PRR204 pKa = 11.84VAAEE208 pKa = 3.72ADD210 pKa = 3.24KK211 pKa = 11.12AAAGSVLRR219 pKa = 11.84AVGAGLQALWRR230 pKa = 11.84NPLLRR235 pKa = 11.84TAFLYY240 pKa = 9.85WGLCACVVGGVMQVALPLLASEE262 pKa = 4.7RR263 pKa = 11.84LHH265 pKa = 6.29GASGLALLMGAHH277 pKa = 6.07GTGSLAGMALFGALGRR293 pKa = 11.84RR294 pKa = 11.84RR295 pKa = 11.84VVNLGVTLLLVDD307 pKa = 4.17ALVGVLLLPMGLVTQAWQGVLLLVAIGVLGGFVQVAVFTWIQQCVPQAMLGRR359 pKa = 11.84MMGIFMFVFMGLAPLAAAVAGWLATLLSLASLFAAVGLFLALSAVLAWLFTPMATLTDD417 pKa = 3.94PALPAQHH424 pKa = 6.3QGG426 pKa = 3.06
Molecular weight: 44.04 kDa
Isoelectric point according different methods:
Peptides (in silico digests for buttom-up proteomics)
Below you can find in silico digests of the whole proteome with Trypsin, Chymotrypsin, Trypsin+LysC, LysN, ArgC proteases suitable for different mass spec machines.| Try ESI |
 |
|---|
| ChTry ESI |
 |
|---|
| ArgC ESI |
 |
|---|
| LysN ESI |
 |
|---|
| TryLysC ESI |
 |
|---|
| Try MALDI |
 |
|---|
| ChTry MALDI |
 |
|---|
| ArgC MALDI |
 |
|---|
| LysN MALDI |
 |
|---|
| TryLysC MALDI |
 |
|---|
| Try LTQ |
 |
|---|
| ChTry LTQ |
 |
|---|
| ArgC LTQ |
 |
|---|
| LysN LTQ |
 |
|---|
| TryLysC LTQ |
 |
|---|
| Try MSlow |
 |
|---|
| ChTry MSlow |
 |
|---|
| ArgC MSlow |
 |
|---|
| LysN MSlow |
 |
|---|
| TryLysC MSlow |
 |
|---|
| Try MShigh |
 |
|---|
| ChTry MShigh |
 |
|---|
| ArgC MShigh |
 |
|---|
| LysN MShigh |
 |
|---|
| TryLysC MShigh |
 |
|---|
General Statistics
Number of major isoforms |
Number of additional isoforms |
Number of all proteins |
Number of amino acids |
Min. Seq. Length |
Max. Seq. Length |
Avg. Seq. Length |
Avg. Mol. Weight |
|---|---|---|---|---|---|---|---|
0 |
1350610 |
49 |
1769 |
334.8 |
36.41 |
Amino acid frequency
Ala |
Cys |
Asp |
Glu |
Phe |
Gly |
His |
Ile |
Lys |
Leu |
|---|---|---|---|---|---|---|---|---|---|
12.436 ± 0.058 | 0.846 ± 0.011 |
5.335 ± 0.027 | 5.562 ± 0.04 |
3.603 ± 0.024 | 8.464 ± 0.039 |
2.193 ± 0.017 | 4.549 ± 0.03 |
3.522 ± 0.033 | 10.386 ± 0.048 |
Met |
Asn |
Gln |
Pro |
Arg |
Ser |
Thr |
Val |
Trp |
Tyr |
|---|---|---|---|---|---|---|---|---|---|
2.566 ± 0.02 | 2.929 ± 0.029 |
5.14 ± 0.025 | 3.735 ± 0.026 |
6.925 ± 0.031 | 5.391 ± 0.027 |
5.1 ± 0.026 | 7.502 ± 0.032 |
1.326 ± 0.018 | 2.49 ± 0.02 |
Most of the basic statistics you can see at this page can be downloaded from this CSV file
Proteome-pI is available under Creative Commons Attribution-NoDerivs license, for more details see here
| Reference: Kozlowski LP. Proteome-pI 2.0: Proteome Isoelectric Point Database Update. Nucleic Acids Res. 2021, doi: 10.1093/nar/gkab944 | Contact: Lukasz P. Kozlowski |
