Gillisia limnaea DSM 15749
Taxonomy: cellular organisms; Bacteria; FCB group; Bacteroidetes/Chlorobi group; Bacteroidetes; Flavobacteriia; Flavobacteriales; Flavobacteriaceae; Gillisia; Gillisia limnaea
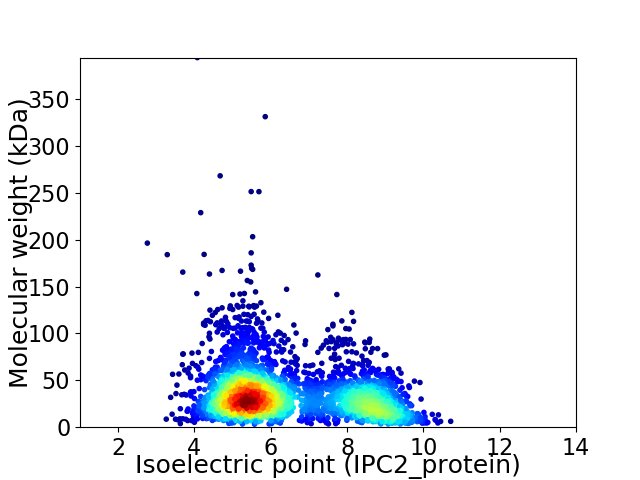
Average proteome isoelectric point is 6.44
Get precalculated fractions of proteins

Virtual 2D-PAGE plot for 3411 proteins (isoelectric point calculated using IPC2_protein)
Get csv file with sequences according to given criteria:
* You can choose from 21 different methods for calculating isoelectric point
Summary statistics related to proteome-wise predictions


Protein with the lowest isoelectric point:
>tr|H2BRS0|H2BRS0_9FLAO Uncharacterized protein OS=Gillisia limnaea DSM 15749 OX=865937 GN=Gilli_0674 PE=4 SV=1
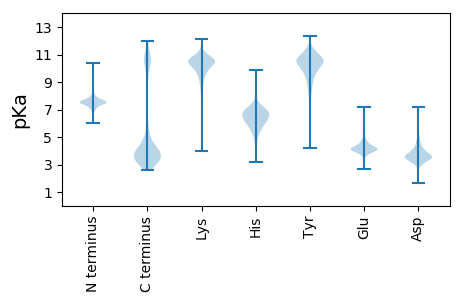
MM1 pKa = 7.63KK2 pKa = 10.4KK3 pKa = 10.42LLLLPFIGLCLTACSVDD20 pKa = 3.99PIEE23 pKa = 4.98DD24 pKa = 3.5QIIGEE29 pKa = 4.62NINEE33 pKa = 3.92VNAALVDD40 pKa = 3.92YY41 pKa = 11.01GCAGPDD47 pKa = 2.94NSMTITYY54 pKa = 9.87SEE56 pKa = 4.0AAAIEE61 pKa = 4.26SWDD64 pKa = 3.87EE65 pKa = 3.72VRR67 pKa = 11.84KK68 pKa = 10.19LYY70 pKa = 10.93LSLLAPGVLRR80 pKa = 11.84NGTFDD85 pKa = 3.62PSIWDD90 pKa = 4.42LINRR94 pKa = 11.84FQDD97 pKa = 3.17QGLGDD102 pKa = 3.9YY103 pKa = 9.58TSEE106 pKa = 3.92YY107 pKa = 9.76TIVDD111 pKa = 4.06GEE113 pKa = 4.55CTDD116 pKa = 3.83SVLLTFTVVPDD127 pKa = 4.19GQSEE131 pKa = 4.54PPCEE135 pKa = 4.09PVDD138 pKa = 4.09AGPDD142 pKa = 3.13NSMTITFSEE151 pKa = 4.28AAAIEE156 pKa = 4.3SWDD159 pKa = 3.87EE160 pKa = 3.72VRR162 pKa = 11.84KK163 pKa = 10.19LYY165 pKa = 10.93LSLLAPGVVRR175 pKa = 11.84NGIFDD180 pKa = 3.94PSIWDD185 pKa = 4.3LINRR189 pKa = 11.84FNDD192 pKa = 3.41QEE194 pKa = 4.25NGGPGDD200 pKa = 3.66YY201 pKa = 9.69STEE204 pKa = 3.89YY205 pKa = 10.44TIGDD209 pKa = 4.13GEE211 pKa = 4.57CTDD214 pKa = 3.84SVLLTVTVIPDD225 pKa = 3.56EE226 pKa = 4.23QSNPACAHH234 pKa = 5.56VNAGPDD240 pKa = 3.27KK241 pKa = 10.65SITMTKK247 pKa = 9.56SQAAAIEE254 pKa = 4.28SWDD257 pKa = 3.87EE258 pKa = 3.72VRR260 pKa = 11.84KK261 pKa = 10.19LYY263 pKa = 10.93LSLLAPGVVRR273 pKa = 11.84NGTFDD278 pKa = 3.62PSIWDD283 pKa = 4.3LINRR287 pKa = 11.84FNDD290 pKa = 3.41QEE292 pKa = 4.25NGGPGDD298 pKa = 3.64YY299 pKa = 8.15TTEE302 pKa = 3.83YY303 pKa = 9.95TIVDD307 pKa = 4.38GEE309 pKa = 4.49CSDD312 pKa = 4.61SVLLTITVIPDD323 pKa = 3.02
MM1 pKa = 7.63KK2 pKa = 10.4KK3 pKa = 10.42LLLLPFIGLCLTACSVDD20 pKa = 3.99PIEE23 pKa = 4.98DD24 pKa = 3.5QIIGEE29 pKa = 4.62NINEE33 pKa = 3.92VNAALVDD40 pKa = 3.92YY41 pKa = 11.01GCAGPDD47 pKa = 2.94NSMTITYY54 pKa = 9.87SEE56 pKa = 4.0AAAIEE61 pKa = 4.26SWDD64 pKa = 3.87EE65 pKa = 3.72VRR67 pKa = 11.84KK68 pKa = 10.19LYY70 pKa = 10.93LSLLAPGVLRR80 pKa = 11.84NGTFDD85 pKa = 3.62PSIWDD90 pKa = 4.42LINRR94 pKa = 11.84FQDD97 pKa = 3.17QGLGDD102 pKa = 3.9YY103 pKa = 9.58TSEE106 pKa = 3.92YY107 pKa = 9.76TIVDD111 pKa = 4.06GEE113 pKa = 4.55CTDD116 pKa = 3.83SVLLTFTVVPDD127 pKa = 4.19GQSEE131 pKa = 4.54PPCEE135 pKa = 4.09PVDD138 pKa = 4.09AGPDD142 pKa = 3.13NSMTITFSEE151 pKa = 4.28AAAIEE156 pKa = 4.3SWDD159 pKa = 3.87EE160 pKa = 3.72VRR162 pKa = 11.84KK163 pKa = 10.19LYY165 pKa = 10.93LSLLAPGVVRR175 pKa = 11.84NGIFDD180 pKa = 3.94PSIWDD185 pKa = 4.3LINRR189 pKa = 11.84FNDD192 pKa = 3.41QEE194 pKa = 4.25NGGPGDD200 pKa = 3.66YY201 pKa = 9.69STEE204 pKa = 3.89YY205 pKa = 10.44TIGDD209 pKa = 4.13GEE211 pKa = 4.57CTDD214 pKa = 3.84SVLLTVTVIPDD225 pKa = 3.56EE226 pKa = 4.23QSNPACAHH234 pKa = 5.56VNAGPDD240 pKa = 3.27KK241 pKa = 10.65SITMTKK247 pKa = 9.56SQAAAIEE254 pKa = 4.28SWDD257 pKa = 3.87EE258 pKa = 3.72VRR260 pKa = 11.84KK261 pKa = 10.19LYY263 pKa = 10.93LSLLAPGVVRR273 pKa = 11.84NGTFDD278 pKa = 3.62PSIWDD283 pKa = 4.3LINRR287 pKa = 11.84FNDD290 pKa = 3.41QEE292 pKa = 4.25NGGPGDD298 pKa = 3.64YY299 pKa = 8.15TTEE302 pKa = 3.83YY303 pKa = 9.95TIVDD307 pKa = 4.38GEE309 pKa = 4.49CSDD312 pKa = 4.61SVLLTITVIPDD323 pKa = 3.02
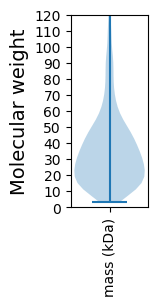
Molecular weight: 35.12 kDa
Isoelectric point according different methods:
Protein with the highest isoelectric point:
>tr|H2BWV0|H2BWV0_9FLAO ABC transporter related protein OS=Gillisia limnaea DSM 15749 OX=865937 GN=Gilli_3526 PE=4 SV=1
MM1 pKa = 7.45KK2 pKa = 9.59RR3 pKa = 11.84TFQPSKK9 pKa = 10.15RR10 pKa = 11.84KK11 pKa = 9.6RR12 pKa = 11.84KK13 pKa = 8.29NKK15 pKa = 9.34HH16 pKa = 4.03GFRR19 pKa = 11.84EE20 pKa = 4.05RR21 pKa = 11.84MASVNGRR28 pKa = 11.84KK29 pKa = 9.21VLARR33 pKa = 11.84RR34 pKa = 11.84RR35 pKa = 11.84AKK37 pKa = 10.09GRR39 pKa = 11.84KK40 pKa = 7.97KK41 pKa = 10.62LSVSSEE47 pKa = 4.04TRR49 pKa = 11.84HH50 pKa = 5.02KK51 pKa = 10.46HH52 pKa = 4.65
MM1 pKa = 7.45KK2 pKa = 9.59RR3 pKa = 11.84TFQPSKK9 pKa = 10.15RR10 pKa = 11.84KK11 pKa = 9.6RR12 pKa = 11.84KK13 pKa = 8.29NKK15 pKa = 9.34HH16 pKa = 4.03GFRR19 pKa = 11.84EE20 pKa = 4.05RR21 pKa = 11.84MASVNGRR28 pKa = 11.84KK29 pKa = 9.21VLARR33 pKa = 11.84RR34 pKa = 11.84RR35 pKa = 11.84AKK37 pKa = 10.09GRR39 pKa = 11.84KK40 pKa = 7.97KK41 pKa = 10.62LSVSSEE47 pKa = 4.04TRR49 pKa = 11.84HH50 pKa = 5.02KK51 pKa = 10.46HH52 pKa = 4.65
Molecular weight: 6.24 kDa
Isoelectric point according different methods:
Peptides (in silico digests for buttom-up proteomics)
Below you can find in silico digests of the whole proteome with Trypsin, Chymotrypsin, Trypsin+LysC, LysN, ArgC proteases suitable for different mass spec machines.| Try ESI |
 |
|---|
| ChTry ESI |
 |
|---|
| ArgC ESI |
 |
|---|
| LysN ESI |
 |
|---|
| TryLysC ESI |
 |
|---|
| Try MALDI |
 |
|---|
| ChTry MALDI |
 |
|---|
| ArgC MALDI |
 |
|---|
| LysN MALDI |
 |
|---|
| TryLysC MALDI |
 |
|---|
| Try LTQ |
 |
|---|
| ChTry LTQ |
 |
|---|
| ArgC LTQ |
 |
|---|
| LysN LTQ |
 |
|---|
| TryLysC LTQ |
 |
|---|
| Try MSlow |
 |
|---|
| ChTry MSlow |
 |
|---|
| ArgC MSlow |
 |
|---|
| LysN MSlow |
 |
|---|
| TryLysC MSlow |
 |
|---|
| Try MShigh |
 |
|---|
| ChTry MShigh |
 |
|---|
| ArgC MShigh |
 |
|---|
| LysN MShigh |
 |
|---|
| TryLysC MShigh |
 |
|---|
General Statistics
Number of major isoforms |
Number of additional isoforms |
Number of all proteins |
Number of amino acids |
Min. Seq. Length |
Max. Seq. Length |
Avg. Seq. Length |
Avg. Mol. Weight |
|---|---|---|---|---|---|---|---|
0 |
1128509 |
30 |
3739 |
330.8 |
37.35 |
Amino acid frequency
Ala |
Cys |
Asp |
Glu |
Phe |
Gly |
His |
Ile |
Lys |
Leu |
|---|---|---|---|---|---|---|---|---|---|
6.416 ± 0.038 | 0.666 ± 0.013 |
5.327 ± 0.032 | 7.228 ± 0.045 |
5.362 ± 0.035 | 6.539 ± 0.044 |
1.698 ± 0.021 | 8.053 ± 0.039 |
7.613 ± 0.053 | 9.625 ± 0.055 |
Met |
Asn |
Gln |
Pro |
Arg |
Ser |
Thr |
Val |
Trp |
Tyr |
|---|---|---|---|---|---|---|---|---|---|
2.271 ± 0.024 | 5.837 ± 0.04 |
3.551 ± 0.026 | 3.353 ± 0.023 |
3.703 ± 0.029 | 6.521 ± 0.031 |
5.332 ± 0.043 | 6.013 ± 0.031 |
1.047 ± 0.016 | 3.844 ± 0.027 |
Most of the basic statistics you can see at this page can be downloaded from this CSV file
Proteome-pI is available under Creative Commons Attribution-NoDerivs license, for more details see here
| Reference: Kozlowski LP. Proteome-pI 2.0: Proteome Isoelectric Point Database Update. Nucleic Acids Res. 2021, doi: 10.1093/nar/gkab944 | Contact: Lukasz P. Kozlowski |
