Terriglobus saanensis (strain ATCC BAA-1853 / DSM 23119 / SP1PR4)
Taxonomy: cellular organisms; Bacteria; Acidobacteria; Acidobacteriia; Acidobacteriales; Acidobacteriaceae; Terriglobus; Terriglobus saanensis
Average proteome isoelectric point is 6.74
Get precalculated fractions of proteins

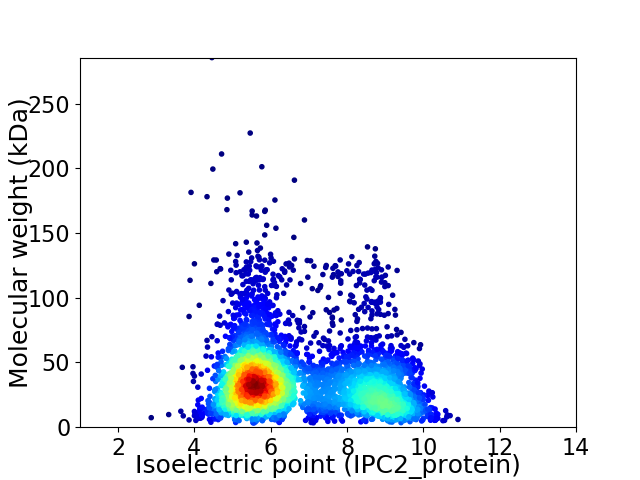
Virtual 2D-PAGE plot for 4177 proteins (isoelectric point calculated using IPC2_protein)
Get csv file with sequences according to given criteria:
* You can choose from 21 different methods for calculating isoelectric point
Summary statistics related to proteome-wise predictions


Protein with the lowest isoelectric point:
>tr|E8V6D7|E8V6D7_TERSS Uncharacterized protein OS=Terriglobus saanensis (strain ATCC BAA-1853 / DSM 23119 / SP1PR4) OX=401053 GN=AciPR4_0769 PE=4 SV=1
MM1 pKa = 7.23KK2 pKa = 10.33RR3 pKa = 11.84SLICAGTILVGLTLLSGCGNSSNNGIGSTTPATPPTPLVAGGAANIVVVQNNTLNVATASDD64 pKa = 4.62SILKK68 pKa = 10.53FSTATNGIVAPATSITGPAGFFLSGVATDD97 pKa = 3.55STGNVYY103 pKa = 8.25VTAVSTTTSVSEE115 pKa = 3.85ILVYY119 pKa = 10.43DD120 pKa = 4.43ANATGAATPMRR131 pKa = 11.84TITSTSLIFPIGITVDD147 pKa = 3.53SAGSIYY153 pKa = 10.96VSDD156 pKa = 4.37APSNSLSNLSNPSSIFVFDD175 pKa = 4.35PKK177 pKa = 11.33ANGVSIPTRR186 pKa = 11.84TITGAATLLNQPLSLAVDD204 pKa = 3.88TAGNLYY210 pKa = 10.74VSDD213 pKa = 4.68LVQLGISVFSPTATGNVAPASTISGPATGLVFPANGVALDD253 pKa = 3.93ASNNIYY259 pKa = 10.39VSSADD264 pKa = 3.3PTGNFGVVAEE274 pKa = 5.02FAAGATGNVAPIKK287 pKa = 9.24TVGGATLGANQGLGGVEE304 pKa = 3.7VDD306 pKa = 3.73SVGNIYY312 pKa = 9.15TVGVFGAFNSFFEE325 pKa = 4.5LAAFAPTATGDD336 pKa = 3.51VTPAILDD343 pKa = 3.54TASAFNISNFGLLAIHH359 pKa = 7.33
MM1 pKa = 7.23KK2 pKa = 10.33RR3 pKa = 11.84SLICAGTILVGLTLLSGCGNSSNNGIGSTTPATPPTPLVAGGAANIVVVQNNTLNVATASDD64 pKa = 4.62SILKK68 pKa = 10.53FSTATNGIVAPATSITGPAGFFLSGVATDD97 pKa = 3.55STGNVYY103 pKa = 8.25VTAVSTTTSVSEE115 pKa = 3.85ILVYY119 pKa = 10.43DD120 pKa = 4.43ANATGAATPMRR131 pKa = 11.84TITSTSLIFPIGITVDD147 pKa = 3.53SAGSIYY153 pKa = 10.96VSDD156 pKa = 4.37APSNSLSNLSNPSSIFVFDD175 pKa = 4.35PKK177 pKa = 11.33ANGVSIPTRR186 pKa = 11.84TITGAATLLNQPLSLAVDD204 pKa = 3.88TAGNLYY210 pKa = 10.74VSDD213 pKa = 4.68LVQLGISVFSPTATGNVAPASTISGPATGLVFPANGVALDD253 pKa = 3.93ASNNIYY259 pKa = 10.39VSSADD264 pKa = 3.3PTGNFGVVAEE274 pKa = 5.02FAAGATGNVAPIKK287 pKa = 9.24TVGGATLGANQGLGGVEE304 pKa = 3.7VDD306 pKa = 3.73SVGNIYY312 pKa = 9.15TVGVFGAFNSFFEE325 pKa = 4.5LAAFAPTATGDD336 pKa = 3.51VTPAILDD343 pKa = 3.54TASAFNISNFGLLAIHH359 pKa = 7.33
Molecular weight: 35.36 kDa
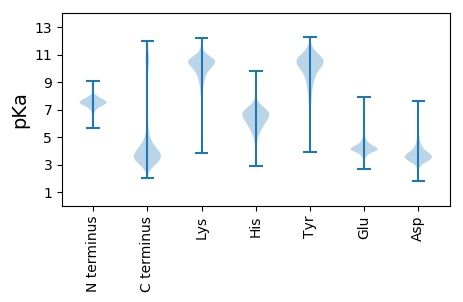
Isoelectric point according different methods:
Protein with the highest isoelectric point:
>tr|E8V745|E8V745_TERSS Uncharacterized protein OS=Terriglobus saanensis (strain ATCC BAA-1853 / DSM 23119 / SP1PR4) OX=401053 GN=AciPR4_0852 PE=4 SV=1
MM1 pKa = 8.0PKK3 pKa = 9.02RR4 pKa = 11.84TFQPNRR10 pKa = 11.84RR11 pKa = 11.84RR12 pKa = 11.84RR13 pKa = 11.84AKK15 pKa = 8.87THH17 pKa = 5.78GFLTRR22 pKa = 11.84MKK24 pKa = 9.16TKK26 pKa = 10.54AGQAVLNRR34 pKa = 11.84RR35 pKa = 11.84RR36 pKa = 11.84AKK38 pKa = 10.03GRR40 pKa = 11.84HH41 pKa = 5.72KK42 pKa = 10.29IAVSAGFRR50 pKa = 11.84DD51 pKa = 3.66
MM1 pKa = 8.0PKK3 pKa = 9.02RR4 pKa = 11.84TFQPNRR10 pKa = 11.84RR11 pKa = 11.84RR12 pKa = 11.84RR13 pKa = 11.84AKK15 pKa = 8.87THH17 pKa = 5.78GFLTRR22 pKa = 11.84MKK24 pKa = 9.16TKK26 pKa = 10.54AGQAVLNRR34 pKa = 11.84RR35 pKa = 11.84RR36 pKa = 11.84AKK38 pKa = 10.03GRR40 pKa = 11.84HH41 pKa = 5.72KK42 pKa = 10.29IAVSAGFRR50 pKa = 11.84DD51 pKa = 3.66
Molecular weight: 5.96 kDa
Isoelectric point according different methods:
Peptides (in silico digests for buttom-up proteomics)
Below you can find in silico digests of the whole proteome with Trypsin, Chymotrypsin, Trypsin+LysC, LysN, ArgC proteases suitable for different mass spec machines.| Try ESI |
 |
|---|
| ChTry ESI |
 |
|---|
| ArgC ESI |
 |
|---|
| LysN ESI |
 |
|---|
| TryLysC ESI |
 |
|---|
| Try MALDI |
 |
|---|
| ChTry MALDI |
 |
|---|
| ArgC MALDI |
 |
|---|
| LysN MALDI |
 |
|---|
| TryLysC MALDI |
 |
|---|
| Try LTQ |
 |
|---|
| ChTry LTQ |
 |
|---|
| ArgC LTQ |
 |
|---|
| LysN LTQ |
 |
|---|
| TryLysC LTQ |
 |
|---|
| Try MSlow |
 |
|---|
| ChTry MSlow |
 |
|---|
| ArgC MSlow |
 |
|---|
| LysN MSlow |
 |
|---|
| TryLysC MSlow |
 |
|---|
| Try MShigh |
 |
|---|
| ChTry MShigh |
 |
|---|
| ArgC MShigh |
 |
|---|
| LysN MShigh |
 |
|---|
| TryLysC MShigh |
 |
|---|
General Statistics
Number of major isoforms |
Number of additional isoforms |
Number of all proteins |
Number of amino acids |
Min. Seq. Length |
Max. Seq. Length |
Avg. Seq. Length |
Avg. Mol. Weight |
|---|---|---|---|---|---|---|---|
0 |
1519388 |
30 |
2699 |
363.8 |
39.75 |
Amino acid frequency
Ala |
Cys |
Asp |
Glu |
Phe |
Gly |
His |
Ile |
Lys |
Leu |
|---|---|---|---|---|---|---|---|---|---|
10.644 ± 0.038 | 0.814 ± 0.011 |
4.989 ± 0.025 | 5.363 ± 0.038 |
4.068 ± 0.025 | 7.944 ± 0.038 |
2.275 ± 0.017 | 5.066 ± 0.028 |
3.857 ± 0.028 | 9.992 ± 0.041 |
Met |
Asn |
Gln |
Pro |
Arg |
Ser |
Thr |
Val |
Trp |
Tyr |
|---|---|---|---|---|---|---|---|---|---|
2.301 ± 0.018 | 3.479 ± 0.037 |
5.177 ± 0.026 | 3.794 ± 0.023 |
5.981 ± 0.038 | 6.549 ± 0.035 |
6.383 ± 0.05 | 7.245 ± 0.034 |
1.334 ± 0.015 | 2.745 ± 0.022 |
Most of the basic statistics you can see at this page can be downloaded from this CSV file
Proteome-pI is available under Creative Commons Attribution-NoDerivs license, for more details see here
| Reference: Kozlowski LP. Proteome-pI 2.0: Proteome Isoelectric Point Database Update. Nucleic Acids Res. 2021, doi: 10.1093/nar/gkab944 | Contact: Lukasz P. Kozlowski |
