Listeria booriae
Taxonomy: cellular organisms; Bacteria; Terrabacteria group; Firmicutes; Bacilli; Bacillales; Listeriaceae; Listeria
Average proteome isoelectric point is 6.2
Get precalculated fractions of proteins

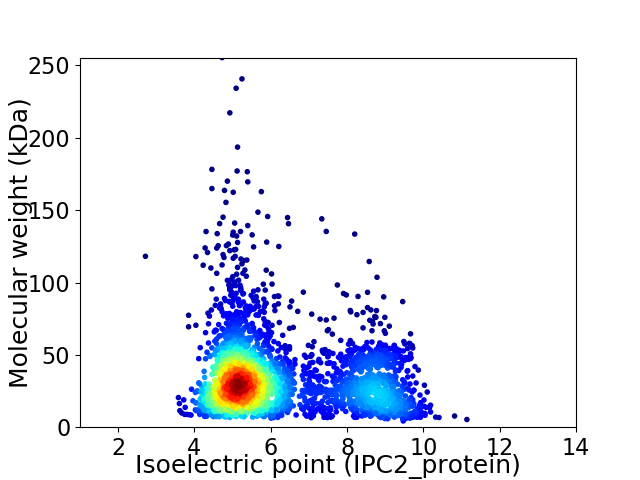
Virtual 2D-PAGE plot for 3104 proteins (isoelectric point calculated using IPC2_protein)
Get csv file with sequences according to given criteria:
* You can choose from 21 different methods for calculating isoelectric point
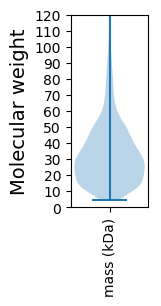
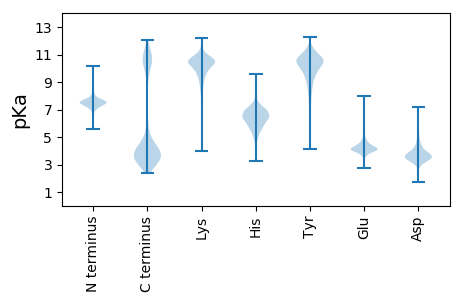
Summary statistics related to proteome-wise predictions


Protein with the lowest isoelectric point:
>tr|A0A099W950|A0A099W950_9LIST Uncharacterized protein OS=Listeria booriae OX=1552123 GN=EP57_06610 PE=4 SV=1
MM1 pKa = 7.29TVLLLIFFGFLLFLCLVALIVGVILFIVRR30 pKa = 11.84KK31 pKa = 9.85GKK33 pKa = 8.79MLGALMMAGSLVLGFPLFGGFMASIIMAAPMEE65 pKa = 4.14YY66 pKa = 10.29HH67 pKa = 6.48NNSTMMHH74 pKa = 7.57DD75 pKa = 4.43DD76 pKa = 3.99LMDD79 pKa = 4.18GSTYY83 pKa = 11.13DD84 pKa = 3.65DD85 pKa = 3.7TGGSDD90 pKa = 4.3DD91 pKa = 3.72SSSYY95 pKa = 11.38YY96 pKa = 10.51DD97 pKa = 5.35DD98 pKa = 3.94SDD100 pKa = 4.54EE101 pKa = 4.63YY102 pKa = 10.98TDD104 pKa = 5.65DD105 pKa = 3.56WDD107 pKa = 3.57EE108 pKa = 4.67DD109 pKa = 3.96EE110 pKa = 5.54YY111 pKa = 12.02YY112 pKa = 10.96SDD114 pKa = 6.23DD115 pKa = 3.44YY116 pKa = 10.82TQYY119 pKa = 11.53KK120 pKa = 9.13VGQAAEE126 pKa = 4.29FQDD129 pKa = 4.34GTWVTVSKK137 pKa = 10.82LEE139 pKa = 3.9KK140 pKa = 8.49WTGDD144 pKa = 3.71SEE146 pKa = 4.67FQTPMAGFYY155 pKa = 10.83VKK157 pKa = 10.1ATILLEE163 pKa = 4.37NKK165 pKa = 10.08GKK167 pKa = 8.78EE168 pKa = 4.35TVDD171 pKa = 4.48FYY173 pKa = 11.84ADD175 pKa = 3.2EE176 pKa = 4.26FQIYY180 pKa = 10.2DD181 pKa = 3.33QDD183 pKa = 3.93NFDD186 pKa = 4.48GEE188 pKa = 4.46NTYY191 pKa = 10.97KK192 pKa = 10.69EE193 pKa = 4.18DD194 pKa = 3.37WNLSLKK200 pKa = 10.45PGAKK204 pKa = 8.82ATRR207 pKa = 11.84TVYY210 pKa = 10.7FDD212 pKa = 3.43VYY214 pKa = 11.13GNGPFHH220 pKa = 6.93VVLSDD225 pKa = 3.49VSWSGSVKK233 pKa = 10.61
MM1 pKa = 7.29TVLLLIFFGFLLFLCLVALIVGVILFIVRR30 pKa = 11.84KK31 pKa = 9.85GKK33 pKa = 8.79MLGALMMAGSLVLGFPLFGGFMASIIMAAPMEE65 pKa = 4.14YY66 pKa = 10.29HH67 pKa = 6.48NNSTMMHH74 pKa = 7.57DD75 pKa = 4.43DD76 pKa = 3.99LMDD79 pKa = 4.18GSTYY83 pKa = 11.13DD84 pKa = 3.65DD85 pKa = 3.7TGGSDD90 pKa = 4.3DD91 pKa = 3.72SSSYY95 pKa = 11.38YY96 pKa = 10.51DD97 pKa = 5.35DD98 pKa = 3.94SDD100 pKa = 4.54EE101 pKa = 4.63YY102 pKa = 10.98TDD104 pKa = 5.65DD105 pKa = 3.56WDD107 pKa = 3.57EE108 pKa = 4.67DD109 pKa = 3.96EE110 pKa = 5.54YY111 pKa = 12.02YY112 pKa = 10.96SDD114 pKa = 6.23DD115 pKa = 3.44YY116 pKa = 10.82TQYY119 pKa = 11.53KK120 pKa = 9.13VGQAAEE126 pKa = 4.29FQDD129 pKa = 4.34GTWVTVSKK137 pKa = 10.82LEE139 pKa = 3.9KK140 pKa = 8.49WTGDD144 pKa = 3.71SEE146 pKa = 4.67FQTPMAGFYY155 pKa = 10.83VKK157 pKa = 10.1ATILLEE163 pKa = 4.37NKK165 pKa = 10.08GKK167 pKa = 8.78EE168 pKa = 4.35TVDD171 pKa = 4.48FYY173 pKa = 11.84ADD175 pKa = 3.2EE176 pKa = 4.26FQIYY180 pKa = 10.2DD181 pKa = 3.33QDD183 pKa = 3.93NFDD186 pKa = 4.48GEE188 pKa = 4.46NTYY191 pKa = 10.97KK192 pKa = 10.69EE193 pKa = 4.18DD194 pKa = 3.37WNLSLKK200 pKa = 10.45PGAKK204 pKa = 8.82ATRR207 pKa = 11.84TVYY210 pKa = 10.7FDD212 pKa = 3.43VYY214 pKa = 11.13GNGPFHH220 pKa = 6.93VVLSDD225 pKa = 3.49VSWSGSVKK233 pKa = 10.61
Molecular weight: 26.24 kDa
Isoelectric point according different methods:
Protein with the highest isoelectric point:
>tr|A0A099WB28|A0A099WB28_9LIST ATP-dependent protease subunit HslV OS=Listeria booriae OX=1552123 GN=hslV PE=3 SV=1
MM1 pKa = 7.35KK2 pKa = 9.43RR3 pKa = 11.84TYY5 pKa = 10.29QPSKK9 pKa = 9.59RR10 pKa = 11.84KK11 pKa = 9.09RR12 pKa = 11.84KK13 pKa = 8.75KK14 pKa = 9.02VHH16 pKa = 5.87GFRR19 pKa = 11.84QRR21 pKa = 11.84MSSKK25 pKa = 9.81NGRR28 pKa = 11.84RR29 pKa = 11.84VLASRR34 pKa = 11.84RR35 pKa = 11.84RR36 pKa = 11.84KK37 pKa = 8.73GRR39 pKa = 11.84KK40 pKa = 8.76VLSAA44 pKa = 4.05
MM1 pKa = 7.35KK2 pKa = 9.43RR3 pKa = 11.84TYY5 pKa = 10.29QPSKK9 pKa = 9.59RR10 pKa = 11.84KK11 pKa = 9.09RR12 pKa = 11.84KK13 pKa = 8.75KK14 pKa = 9.02VHH16 pKa = 5.87GFRR19 pKa = 11.84QRR21 pKa = 11.84MSSKK25 pKa = 9.81NGRR28 pKa = 11.84RR29 pKa = 11.84VLASRR34 pKa = 11.84RR35 pKa = 11.84RR36 pKa = 11.84KK37 pKa = 8.73GRR39 pKa = 11.84KK40 pKa = 8.76VLSAA44 pKa = 4.05
Molecular weight: 5.31 kDa
Isoelectric point according different methods:
Peptides (in silico digests for buttom-up proteomics)
Below you can find in silico digests of the whole proteome with Trypsin, Chymotrypsin, Trypsin+LysC, LysN, ArgC proteases suitable for different mass spec machines.| Try ESI |
 |
|---|
| ChTry ESI |
 |
|---|
| ArgC ESI |
 |
|---|
| LysN ESI |
 |
|---|
| TryLysC ESI |
 |
|---|
| Try MALDI |
 |
|---|
| ChTry MALDI |
 |
|---|
| ArgC MALDI |
 |
|---|
| LysN MALDI |
 |
|---|
| TryLysC MALDI |
 |
|---|
| Try LTQ |
 |
|---|
| ChTry LTQ |
 |
|---|
| ArgC LTQ |
 |
|---|
| LysN LTQ |
 |
|---|
| TryLysC LTQ |
 |
|---|
| Try MSlow |
 |
|---|
| ChTry MSlow |
 |
|---|
| ArgC MSlow |
 |
|---|
| LysN MSlow |
 |
|---|
| TryLysC MSlow |
 |
|---|
| Try MShigh |
 |
|---|
| ChTry MShigh |
 |
|---|
| ArgC MShigh |
 |
|---|
| LysN MShigh |
 |
|---|
| TryLysC MShigh |
 |
|---|
General Statistics
Number of major isoforms |
Number of additional isoforms |
Number of all proteins |
Number of amino acids |
Min. Seq. Length |
Max. Seq. Length |
Avg. Seq. Length |
Avg. Mol. Weight |
|---|---|---|---|---|---|---|---|
0 |
990240 |
37 |
2366 |
319.0 |
35.57 |
Amino acid frequency
Ala |
Cys |
Asp |
Glu |
Phe |
Gly |
His |
Ile |
Lys |
Leu |
|---|---|---|---|---|---|---|---|---|---|
8.229 ± 0.057 | 0.626 ± 0.011 |
5.576 ± 0.051 | 6.65 ± 0.046 |
4.548 ± 0.04 | 6.764 ± 0.034 |
1.847 ± 0.022 | 7.469 ± 0.048 |
6.489 ± 0.04 | 9.421 ± 0.056 |
Met |
Asn |
Gln |
Pro |
Arg |
Ser |
Thr |
Val |
Trp |
Tyr |
|---|---|---|---|---|---|---|---|---|---|
2.748 ± 0.025 | 4.433 ± 0.035 |
3.531 ± 0.027 | 3.834 ± 0.031 |
3.863 ± 0.03 | 5.62 ± 0.031 |
6.43 ± 0.07 | 7.347 ± 0.044 |
1.011 ± 0.018 | 3.565 ± 0.027 |
Most of the basic statistics you can see at this page can be downloaded from this CSV file
Proteome-pI is available under Creative Commons Attribution-NoDerivs license, for more details see here
| Reference: Kozlowski LP. Proteome-pI 2.0: Proteome Isoelectric Point Database Update. Nucleic Acids Res. 2021, doi: 10.1093/nar/gkab944 | Contact: Lukasz P. Kozlowski |
