Pseudomonas phage Skulduggery
Taxonomy: Viruses; Duplodnaviria; Heunggongvirae; Uroviricota; Caudoviricetes; Caudovirales; Podoviridae; unclassified Podoviridae
Average proteome isoelectric point is 6.34
Get precalculated fractions of proteins

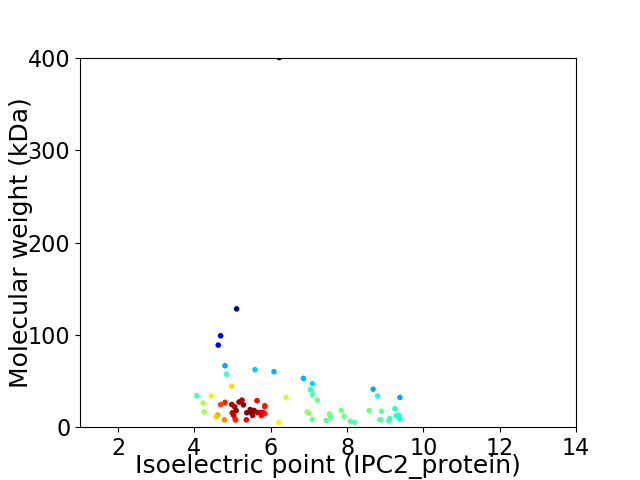
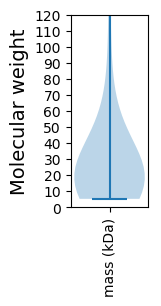
Virtual 2D-PAGE plot for 72 proteins (isoelectric point calculated using IPC2_protein)
Get csv file with sequences according to given criteria:
* You can choose from 21 different methods for calculating isoelectric point
Summary statistics related to proteome-wise predictions


Protein with the lowest isoelectric point:
>tr|A0A1Y0SZB0|A0A1Y0SZB0_9CAUD Uncharacterized protein OS=Pseudomonas phage Skulduggery OX=2006671 GN=SKUL_14 PE=4 SV=1
MM1 pKa = 7.54SKK3 pKa = 9.97QPQTLTVGGKK13 pKa = 9.22EE14 pKa = 3.84LVEE17 pKa = 4.62GYY19 pKa = 10.87GFAFVGNYY27 pKa = 9.95FMDD30 pKa = 4.73GKK32 pKa = 9.86HH33 pKa = 5.24GQIGVSGGFDD43 pKa = 3.33EE44 pKa = 4.71EE45 pKa = 4.65TAHH48 pKa = 5.76ITATISILTILGKK61 pKa = 10.6AFDD64 pKa = 4.86RR65 pKa = 11.84NLQSGVPAQPLIEE78 pKa = 5.06DD79 pKa = 3.83PVFTLTIDD87 pKa = 3.92GLPDD91 pKa = 4.0FVSGRR96 pKa = 11.84TEE98 pKa = 4.51PYY100 pKa = 9.02PLKK103 pKa = 10.69AVYY106 pKa = 10.0QLGADD111 pKa = 4.56LAADD115 pKa = 4.31DD116 pKa = 4.27TPGAYY121 pKa = 9.98GEE123 pKa = 5.0LIVDD127 pKa = 3.69AGYY130 pKa = 10.77NYY132 pKa = 10.05EE133 pKa = 3.9RR134 pKa = 11.84AEE136 pKa = 4.43AIGAQRR142 pKa = 11.84IVQQIAAEE150 pKa = 4.12LAAQEE155 pKa = 4.32EE156 pKa = 4.8
MM1 pKa = 7.54SKK3 pKa = 9.97QPQTLTVGGKK13 pKa = 9.22EE14 pKa = 3.84LVEE17 pKa = 4.62GYY19 pKa = 10.87GFAFVGNYY27 pKa = 9.95FMDD30 pKa = 4.73GKK32 pKa = 9.86HH33 pKa = 5.24GQIGVSGGFDD43 pKa = 3.33EE44 pKa = 4.71EE45 pKa = 4.65TAHH48 pKa = 5.76ITATISILTILGKK61 pKa = 10.6AFDD64 pKa = 4.86RR65 pKa = 11.84NLQSGVPAQPLIEE78 pKa = 5.06DD79 pKa = 3.83PVFTLTIDD87 pKa = 3.92GLPDD91 pKa = 4.0FVSGRR96 pKa = 11.84TEE98 pKa = 4.51PYY100 pKa = 9.02PLKK103 pKa = 10.69AVYY106 pKa = 10.0QLGADD111 pKa = 4.56LAADD115 pKa = 4.31DD116 pKa = 4.27TPGAYY121 pKa = 9.98GEE123 pKa = 5.0LIVDD127 pKa = 3.69AGYY130 pKa = 10.77NYY132 pKa = 10.05EE133 pKa = 3.9RR134 pKa = 11.84AEE136 pKa = 4.43AIGAQRR142 pKa = 11.84IVQQIAAEE150 pKa = 4.12LAAQEE155 pKa = 4.32EE156 pKa = 4.8
Molecular weight: 16.61 kDa
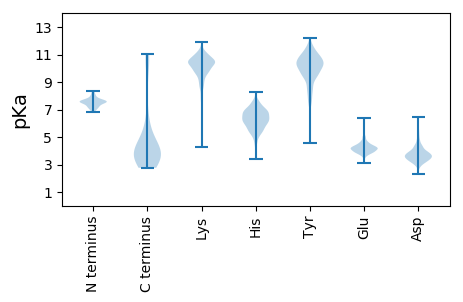
Isoelectric point according different methods:
Protein with the highest isoelectric point:
>tr|A0A1Y0SZK2|A0A1Y0SZK2_9CAUD Uncharacterized protein OS=Pseudomonas phage Skulduggery OX=2006671 GN=SKUL_7 PE=4 SV=1
MM1 pKa = 7.14VSAPGRR7 pKa = 11.84RR8 pKa = 11.84DD9 pKa = 4.2DD10 pKa = 4.85IMLKK14 pKa = 8.51IHH16 pKa = 6.57ARR18 pKa = 11.84VEE20 pKa = 4.2VVDD23 pKa = 3.79MGFVLDD29 pKa = 5.24GKK31 pKa = 9.82PSPCHH36 pKa = 6.48LWTGPHH42 pKa = 6.41SGTGRR47 pKa = 11.84GGGYY51 pKa = 10.84GRR53 pKa = 11.84MHH55 pKa = 7.62LSGQTVAVHH64 pKa = 5.89IVVFTHH70 pKa = 6.81FYY72 pKa = 10.82GYY74 pKa = 11.05VPGKK78 pKa = 10.04KK79 pKa = 9.86QIDD82 pKa = 3.91HH83 pKa = 6.47KK84 pKa = 10.93CSNRR88 pKa = 11.84TCCNPAHH95 pKa = 6.27LQMVTHH101 pKa = 6.77KK102 pKa = 10.53QNQRR106 pKa = 11.84LRR108 pKa = 11.84DD109 pKa = 3.5KK110 pKa = 11.04RR111 pKa = 11.84AGAKK115 pKa = 9.54KK116 pKa = 10.36AA117 pKa = 3.38
MM1 pKa = 7.14VSAPGRR7 pKa = 11.84RR8 pKa = 11.84DD9 pKa = 4.2DD10 pKa = 4.85IMLKK14 pKa = 8.51IHH16 pKa = 6.57ARR18 pKa = 11.84VEE20 pKa = 4.2VVDD23 pKa = 3.79MGFVLDD29 pKa = 5.24GKK31 pKa = 9.82PSPCHH36 pKa = 6.48LWTGPHH42 pKa = 6.41SGTGRR47 pKa = 11.84GGGYY51 pKa = 10.84GRR53 pKa = 11.84MHH55 pKa = 7.62LSGQTVAVHH64 pKa = 5.89IVVFTHH70 pKa = 6.81FYY72 pKa = 10.82GYY74 pKa = 11.05VPGKK78 pKa = 10.04KK79 pKa = 9.86QIDD82 pKa = 3.91HH83 pKa = 6.47KK84 pKa = 10.93CSNRR88 pKa = 11.84TCCNPAHH95 pKa = 6.27LQMVTHH101 pKa = 6.77KK102 pKa = 10.53QNQRR106 pKa = 11.84LRR108 pKa = 11.84DD109 pKa = 3.5KK110 pKa = 11.04RR111 pKa = 11.84AGAKK115 pKa = 9.54KK116 pKa = 10.36AA117 pKa = 3.38
Molecular weight: 12.94 kDa
Isoelectric point according different methods:
Peptides (in silico digests for buttom-up proteomics)
Below you can find in silico digests of the whole proteome with Trypsin, Chymotrypsin, Trypsin+LysC, LysN, ArgC proteases suitable for different mass spec machines.| Try ESI |
 |
|---|
| ChTry ESI |
 |
|---|
| ArgC ESI |
 |
|---|
| LysN ESI |
 |
|---|
| TryLysC ESI |
 |
|---|
| Try MALDI |
 |
|---|
| ChTry MALDI |
 |
|---|
| ArgC MALDI |
 |
|---|
| LysN MALDI |
 |
|---|
| TryLysC MALDI |
 |
|---|
| Try LTQ |
 |
|---|
| ChTry LTQ |
 |
|---|
| ArgC LTQ |
 |
|---|
| LysN LTQ |
 |
|---|
| TryLysC LTQ |
 |
|---|
| Try MSlow |
 |
|---|
| ChTry MSlow |
 |
|---|
| ArgC MSlow |
 |
|---|
| LysN MSlow |
 |
|---|
| TryLysC MSlow |
 |
|---|
| Try MShigh |
 |
|---|
| ChTry MShigh |
 |
|---|
| ArgC MShigh |
 |
|---|
| LysN MShigh |
 |
|---|
| TryLysC MShigh |
 |
|---|
General Statistics
Number of major isoforms |
Number of additional isoforms |
Number of all proteins |
Number of amino acids |
Min. Seq. Length |
Max. Seq. Length |
Avg. Seq. Length |
Avg. Mol. Weight |
|---|---|---|---|---|---|---|---|
0 |
20252 |
47 |
3695 |
281.3 |
30.8 |
Amino acid frequency
Ala |
Cys |
Asp |
Glu |
Phe |
Gly |
His |
Ile |
Lys |
Leu |
|---|---|---|---|---|---|---|---|---|---|
11.382 ± 0.474 | 0.879 ± 0.164 |
6.197 ± 0.193 | 6.73 ± 0.284 |
3.373 ± 0.162 | 8.72 ± 0.368 |
1.778 ± 0.12 | 4.498 ± 0.185 |
5.555 ± 0.257 | 7.728 ± 0.25 |
Met |
Asn |
Gln |
Pro |
Arg |
Ser |
Thr |
Val |
Trp |
Tyr |
|---|---|---|---|---|---|---|---|---|---|
2.79 ± 0.147 | 3.733 ± 0.121 |
4.8 ± 0.222 | 4.829 ± 0.217 |
5.792 ± 0.222 | 5.16 ± 0.181 |
6.059 ± 0.243 | 5.915 ± 0.267 |
1.358 ± 0.133 | 2.726 ± 0.139 |
Most of the basic statistics you can see at this page can be downloaded from this CSV file
Proteome-pI is available under Creative Commons Attribution-NoDerivs license, for more details see here
| Reference: Kozlowski LP. Proteome-pI 2.0: Proteome Isoelectric Point Database Update. Nucleic Acids Res. 2021, doi: 10.1093/nar/gkab944 | Contact: Lukasz P. Kozlowski |
