Sulfurovum lithotrophicum
Taxonomy: cellular organisms; Bacteria; Proteobacteria; delta/epsilon subdivisions; Epsilonproteobacteria; Campylobacterales; Sulfurovaceae; Sulfurovum
Average proteome isoelectric point is 6.38
Get precalculated fractions of proteins

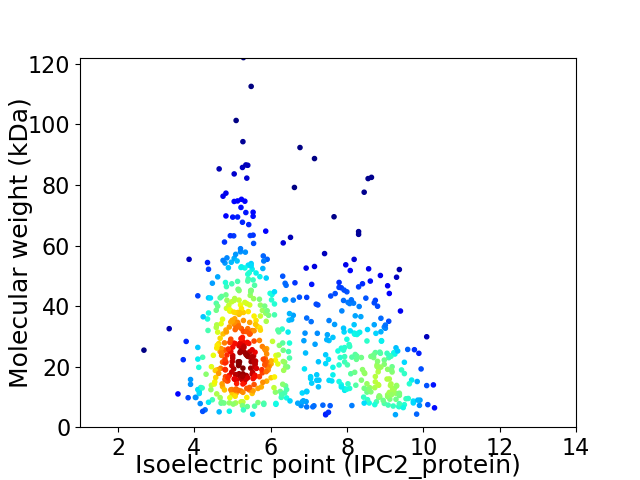
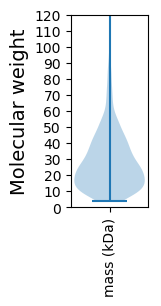
Virtual 2D-PAGE plot for 666 proteins (isoelectric point calculated using IPC2_protein)
Get csv file with sequences according to given criteria:
* You can choose from 21 different methods for calculating isoelectric point
Summary statistics related to proteome-wise predictions


Protein with the lowest isoelectric point:
>tr|A0A2T4CQ15|A0A2T4CQ15_9PROT Long-chain fatty acid transporter (Fragment) OS=Sulfurovum lithotrophicum OX=206403 GN=C9926_01835 PE=3 SV=1
KKK2 pKa = 10.16QGIAYYY8 pKa = 7.73DDD10 pKa = 3.36DDD12 pKa = 2.7DDD14 pKa = 4.36NVDDD18 pKa = 3.4YY19 pKa = 10.63ASVVTDDD26 pKa = 4.37DD27 pKa = 4.81ALGSQDDD34 pKa = 4.38DD35 pKa = 4.3TEEE38 pKa = 4.27TCPNCSTTPVCPIDDD53 pKa = 3.76TPICPEEE60 pKa = 3.72TTEEE64 pKa = 3.84STPNTPAMSGTTIIPLLGGEEE85 pKa = 4.39LVSFSQATHHH95 pKa = 5.69QVTLNDDD102 pKa = 4.44EEE104 pKa = 5.47DD105 pKa = 3.52DD106 pKa = 3.83LVYYY110 pKa = 10.18PNPGYYY116 pKa = 10.94GTDDD120 pKa = 2.5FTYYY124 pKa = 8.23TRR126 pKa = 11.84DDD128 pKa = 3.03NGNEEE133 pKa = 4.21VRR135 pKa = 11.84TATVTVAPVITSRR148 pKa = 11.84GEEE151 pKa = 3.84LDDD154 pKa = 3.11LGIGEEE160 pKa = 4.25LISFTQPSYYY170 pKa = 11.45VIVLDDD176 pKa = 5.69DD177 pKa = 4.44GTPDDD182 pKa = 6.04DD183 pKa = 4.5TDDD186 pKa = 3.99DD187 pKa = 3.98LRR189 pKa = 11.84YYY191 pKa = 9.65PNDDD195 pKa = 4.37YYY197 pKa = 11.57GLDDD201 pKa = 3.15FSYYY205 pKa = 9.79IRR207 pKa = 11.84DDD209 pKa = 3.37AGNVVTKKK217 pKa = 10.58MTFTVDDD224 pKa = 3.23VKKK227 pKa = 10.18DDD229 pKa = 4.72GDDD232 pKa = 3.71LDDD235 pKa = 4.89KK236 pKa = 11.15SIMLLMFFTCLIGLYYY252 pKa = 7.8YY253 pKa = 10.12RR254 pKa = 11.84RR255 pKa = 11.84EEE257 pKa = 3.64EE258 pKa = 3.98SIKKK262 pKa = 10.18KK263 pKa = 9.94EE264 pKa = 3.92
KKK2 pKa = 10.16QGIAYYY8 pKa = 7.73DDD10 pKa = 3.36DDD12 pKa = 2.7DDD14 pKa = 4.36NVDDD18 pKa = 3.4YY19 pKa = 10.63ASVVTDDD26 pKa = 4.37DD27 pKa = 4.81ALGSQDDD34 pKa = 4.38DD35 pKa = 4.3TEEE38 pKa = 4.27TCPNCSTTPVCPIDDD53 pKa = 3.76TPICPEEE60 pKa = 3.72TTEEE64 pKa = 3.84STPNTPAMSGTTIIPLLGGEEE85 pKa = 4.39LVSFSQATHHH95 pKa = 5.69QVTLNDDD102 pKa = 4.44EEE104 pKa = 5.47DD105 pKa = 3.52DD106 pKa = 3.83LVYYY110 pKa = 10.18PNPGYYY116 pKa = 10.94GTDDD120 pKa = 2.5FTYYY124 pKa = 8.23TRR126 pKa = 11.84DDD128 pKa = 3.03NGNEEE133 pKa = 4.21VRR135 pKa = 11.84TATVTVAPVITSRR148 pKa = 11.84GEEE151 pKa = 3.84LDDD154 pKa = 3.11LGIGEEE160 pKa = 4.25LISFTQPSYYY170 pKa = 11.45VIVLDDD176 pKa = 5.69DD177 pKa = 4.44GTPDDD182 pKa = 6.04DD183 pKa = 4.5TDDD186 pKa = 3.99DD187 pKa = 3.98LRR189 pKa = 11.84YYY191 pKa = 9.65PNDDD195 pKa = 4.37YYY197 pKa = 11.57GLDDD201 pKa = 3.15FSYYY205 pKa = 9.79IRR207 pKa = 11.84DDD209 pKa = 3.37AGNVVTKKK217 pKa = 10.58MTFTVDDD224 pKa = 3.23VKKK227 pKa = 10.18DDD229 pKa = 4.72GDDD232 pKa = 3.71LDDD235 pKa = 4.89KK236 pKa = 11.15SIMLLMFFTCLIGLYYY252 pKa = 7.8YY253 pKa = 10.12RR254 pKa = 11.84RR255 pKa = 11.84EEE257 pKa = 3.64EE258 pKa = 3.98SIKKK262 pKa = 10.18KK263 pKa = 9.94EE264 pKa = 3.92
Molecular weight: 28.33 kDa
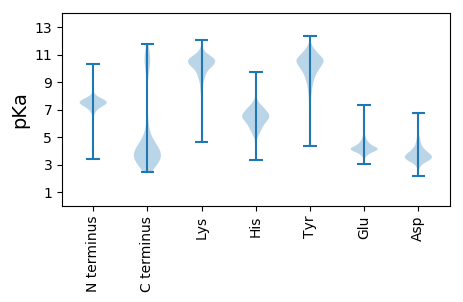
Isoelectric point according different methods:
Protein with the highest isoelectric point:
>tr|A0A2T4CP98|A0A2T4CP98_9PROT Aspartate transcarbamylase (Fragment) OS=Sulfurovum lithotrophicum OX=206403 GN=C9926_03110 PE=3 SV=1
GG1 pKa = 7.41IGLTTARR8 pKa = 11.84EE9 pKa = 4.13ILDD12 pKa = 4.09KK13 pKa = 11.36ADD15 pKa = 5.16LPYY18 pKa = 11.29QMNSDD23 pKa = 4.02DD24 pKa = 5.04LSGEE28 pKa = 3.95EE29 pKa = 3.5ITRR32 pKa = 11.84IRR34 pKa = 11.84KK35 pKa = 9.32IIEE38 pKa = 3.56NDD40 pKa = 3.54YY41 pKa = 11.08VVEE44 pKa = 4.11GDD46 pKa = 3.17KK47 pKa = 10.91RR48 pKa = 11.84RR49 pKa = 11.84EE50 pKa = 3.56VSMDD54 pKa = 2.41IRR56 pKa = 11.84RR57 pKa = 11.84LMDD60 pKa = 4.05LGCYY64 pKa = 9.41RR65 pKa = 11.84GRR67 pKa = 11.84RR68 pKa = 11.84HH69 pKa = 6.29RR70 pKa = 11.84QGLPCRR76 pKa = 11.84GQRR79 pKa = 11.84TKK81 pKa = 10.95TNARR85 pKa = 11.84TRR87 pKa = 11.84KK88 pKa = 7.95GPRR91 pKa = 11.84RR92 pKa = 11.84GSVCRR97 pKa = 3.94
GG1 pKa = 7.41IGLTTARR8 pKa = 11.84EE9 pKa = 4.13ILDD12 pKa = 4.09KK13 pKa = 11.36ADD15 pKa = 5.16LPYY18 pKa = 11.29QMNSDD23 pKa = 4.02DD24 pKa = 5.04LSGEE28 pKa = 3.95EE29 pKa = 3.5ITRR32 pKa = 11.84IRR34 pKa = 11.84KK35 pKa = 9.32IIEE38 pKa = 3.56NDD40 pKa = 3.54YY41 pKa = 11.08VVEE44 pKa = 4.11GDD46 pKa = 3.17KK47 pKa = 10.91RR48 pKa = 11.84RR49 pKa = 11.84EE50 pKa = 3.56VSMDD54 pKa = 2.41IRR56 pKa = 11.84RR57 pKa = 11.84LMDD60 pKa = 4.05LGCYY64 pKa = 9.41RR65 pKa = 11.84GRR67 pKa = 11.84RR68 pKa = 11.84HH69 pKa = 6.29RR70 pKa = 11.84QGLPCRR76 pKa = 11.84GQRR79 pKa = 11.84TKK81 pKa = 10.95TNARR85 pKa = 11.84TRR87 pKa = 11.84KK88 pKa = 7.95GPRR91 pKa = 11.84RR92 pKa = 11.84GSVCRR97 pKa = 3.94
Molecular weight: 11.23 kDa
Isoelectric point according different methods:
Peptides (in silico digests for buttom-up proteomics)
Below you can find in silico digests of the whole proteome with Trypsin, Chymotrypsin, Trypsin+LysC, LysN, ArgC proteases suitable for different mass spec machines.| Try ESI |
 |
|---|
| ChTry ESI |
 |
|---|
| ArgC ESI |
 |
|---|
| LysN ESI |
 |
|---|
| TryLysC ESI |
 |
|---|
| Try MALDI |
 |
|---|
| ChTry MALDI |
 |
|---|
| ArgC MALDI |
 |
|---|
| LysN MALDI |
 |
|---|
| TryLysC MALDI |
 |
|---|
| Try LTQ |
 |
|---|
| ChTry LTQ |
 |
|---|
| ArgC LTQ |
 |
|---|
| LysN LTQ |
 |
|---|
| TryLysC LTQ |
 |
|---|
| Try MSlow |
 |
|---|
| ChTry MSlow |
 |
|---|
| ArgC MSlow |
 |
|---|
| LysN MSlow |
 |
|---|
| TryLysC MSlow |
 |
|---|
| Try MShigh |
 |
|---|
| ChTry MShigh |
 |
|---|
| ArgC MShigh |
 |
|---|
| LysN MShigh |
 |
|---|
| TryLysC MShigh |
 |
|---|
General Statistics
Number of major isoforms |
Number of additional isoforms |
Number of all proteins |
Number of amino acids |
Min. Seq. Length |
Max. Seq. Length |
Avg. Seq. Length |
Avg. Mol. Weight |
|---|---|---|---|---|---|---|---|
0 |
170421 |
34 |
1101 |
255.9 |
28.85 |
Amino acid frequency
Ala |
Cys |
Asp |
Glu |
Phe |
Gly |
His |
Ile |
Lys |
Leu |
|---|---|---|---|---|---|---|---|---|---|
7.057 ± 0.107 | 0.911 ± 0.036 |
5.78 ± 0.071 | 7.29 ± 0.09 |
4.597 ± 0.078 | 6.123 ± 0.106 |
2.212 ± 0.048 | 7.781 ± 0.097 |
8.238 ± 0.114 | 9.681 ± 0.109 |
Met |
Asn |
Gln |
Pro |
Arg |
Ser |
Thr |
Val |
Trp |
Tyr |
|---|---|---|---|---|---|---|---|---|---|
2.797 ± 0.052 | 4.709 ± 0.087 |
3.155 ± 0.05 | 3.041 ± 0.052 |
3.488 ± 0.072 | 6.166 ± 0.082 |
5.793 ± 0.085 | 6.372 ± 0.085 |
0.811 ± 0.031 | 3.998 ± 0.074 |
Most of the basic statistics you can see at this page can be downloaded from this CSV file
Proteome-pI is available under Creative Commons Attribution-NoDerivs license, for more details see here
| Reference: Kozlowski LP. Proteome-pI 2.0: Proteome Isoelectric Point Database Update. Nucleic Acids Res. 2021, doi: 10.1093/nar/gkab944 | Contact: Lukasz P. Kozlowski |
