Streptococcus satellite phage Javan397
Taxonomy: Viruses; unclassified bacterial viruses
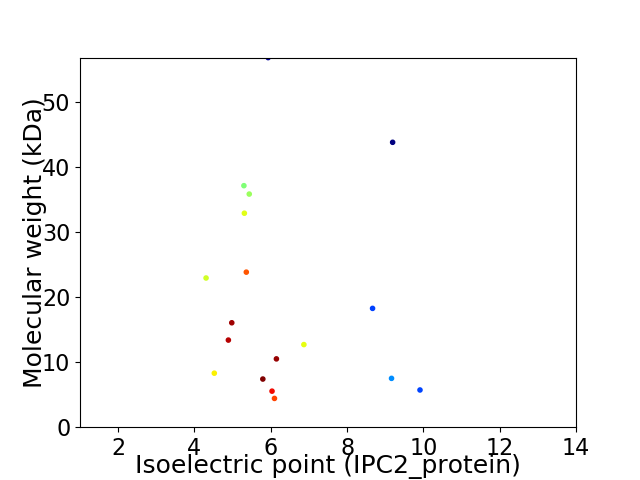
Average proteome isoelectric point is 6.22
Get precalculated fractions of proteins

Virtual 2D-PAGE plot for 18 proteins (isoelectric point calculated using IPC2_protein)
Get csv file with sequences according to given criteria:
* You can choose from 21 different methods for calculating isoelectric point
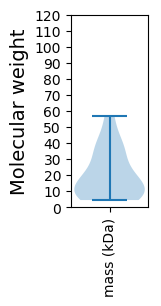
Summary statistics related to proteome-wise predictions


Protein with the lowest isoelectric point:
>tr|A0A4D5ZM92|A0A4D5ZM92_9VIRU Uncharacterized protein OS=Streptococcus satellite phage Javan397 OX=2558677 GN=JavanS397_0012 PE=4 SV=1
MM1 pKa = 7.44IRR3 pKa = 11.84NNLAKK8 pKa = 10.79LMIDD12 pKa = 3.64RR13 pKa = 11.84GISATQLYY21 pKa = 9.73NDD23 pKa = 3.75TGIARR28 pKa = 11.84STISKK33 pKa = 9.86ISNNNTDD40 pKa = 4.38KK41 pKa = 11.09ISLQTIDD48 pKa = 4.92KK49 pKa = 8.86ICNYY53 pKa = 10.13LGVSPMQFFDD63 pKa = 3.69FLSYY67 pKa = 9.93EE68 pKa = 4.39VKK70 pKa = 10.63VSCGFDD76 pKa = 3.14DD77 pKa = 4.55YY78 pKa = 11.52EE79 pKa = 4.51TFEE82 pKa = 4.46EE83 pKa = 4.49MIINYY88 pKa = 9.42KK89 pKa = 10.23DD90 pKa = 3.07NSYY93 pKa = 10.67IKK95 pKa = 9.94EE96 pKa = 4.16KK97 pKa = 10.35AWLSISFYY105 pKa = 11.44SMNILKK111 pKa = 10.75YY112 pKa = 10.68NFDD115 pKa = 3.5FDD117 pKa = 4.54FYY119 pKa = 10.92YY120 pKa = 10.4INDD123 pKa = 3.75FEE125 pKa = 4.49EE126 pKa = 5.95GYY128 pKa = 9.94PFDD131 pKa = 5.41DD132 pKa = 5.34GYY134 pKa = 10.66IAYY137 pKa = 9.32LINMEE142 pKa = 4.29YY143 pKa = 10.57SSKK146 pKa = 10.89NPSAEE151 pKa = 3.67IFNQIPIQFKK161 pKa = 10.36NDD163 pKa = 3.27IVNMAKK169 pKa = 10.54DD170 pKa = 3.42SLSEE174 pKa = 3.72FFNVSKK180 pKa = 10.81EE181 pKa = 3.93SATIKK186 pKa = 10.7EE187 pKa = 4.17FDD189 pKa = 3.64PEE191 pKa = 4.03FLEE194 pKa = 4.9FLL196 pKa = 4.13
MM1 pKa = 7.44IRR3 pKa = 11.84NNLAKK8 pKa = 10.79LMIDD12 pKa = 3.64RR13 pKa = 11.84GISATQLYY21 pKa = 9.73NDD23 pKa = 3.75TGIARR28 pKa = 11.84STISKK33 pKa = 9.86ISNNNTDD40 pKa = 4.38KK41 pKa = 11.09ISLQTIDD48 pKa = 4.92KK49 pKa = 8.86ICNYY53 pKa = 10.13LGVSPMQFFDD63 pKa = 3.69FLSYY67 pKa = 9.93EE68 pKa = 4.39VKK70 pKa = 10.63VSCGFDD76 pKa = 3.14DD77 pKa = 4.55YY78 pKa = 11.52EE79 pKa = 4.51TFEE82 pKa = 4.46EE83 pKa = 4.49MIINYY88 pKa = 9.42KK89 pKa = 10.23DD90 pKa = 3.07NSYY93 pKa = 10.67IKK95 pKa = 9.94EE96 pKa = 4.16KK97 pKa = 10.35AWLSISFYY105 pKa = 11.44SMNILKK111 pKa = 10.75YY112 pKa = 10.68NFDD115 pKa = 3.5FDD117 pKa = 4.54FYY119 pKa = 10.92YY120 pKa = 10.4INDD123 pKa = 3.75FEE125 pKa = 4.49EE126 pKa = 5.95GYY128 pKa = 9.94PFDD131 pKa = 5.41DD132 pKa = 5.34GYY134 pKa = 10.66IAYY137 pKa = 9.32LINMEE142 pKa = 4.29YY143 pKa = 10.57SSKK146 pKa = 10.89NPSAEE151 pKa = 3.67IFNQIPIQFKK161 pKa = 10.36NDD163 pKa = 3.27IVNMAKK169 pKa = 10.54DD170 pKa = 3.42SLSEE174 pKa = 3.72FFNVSKK180 pKa = 10.81EE181 pKa = 3.93SATIKK186 pKa = 10.7EE187 pKa = 4.17FDD189 pKa = 3.64PEE191 pKa = 4.03FLEE194 pKa = 4.9FLL196 pKa = 4.13
Molecular weight: 22.97 kDa
Isoelectric point according different methods:
Protein with the highest isoelectric point:
>tr|A0A4D5ZMK4|A0A4D5ZMK4_9VIRU Uncharacterized protein OS=Streptococcus satellite phage Javan397 OX=2558677 GN=JavanS397_0018 PE=4 SV=1
MM1 pKa = 7.81EE2 pKa = 4.55YY3 pKa = 10.36SISHH7 pKa = 5.81PAEE10 pKa = 3.69RR11 pKa = 11.84QRR13 pKa = 11.84IRR15 pKa = 11.84GIGKK19 pKa = 9.45EE20 pKa = 3.72KK21 pKa = 10.55DD22 pKa = 3.12RR23 pKa = 11.84RR24 pKa = 11.84PTLDD28 pKa = 3.15QIKK31 pKa = 9.98EE32 pKa = 3.96RR33 pKa = 11.84QQLKK37 pKa = 10.2KK38 pKa = 10.63LKK40 pKa = 10.11KK41 pKa = 9.17KK42 pKa = 10.31RR43 pKa = 11.84NRR45 pKa = 11.84GKK47 pKa = 10.6
MM1 pKa = 7.81EE2 pKa = 4.55YY3 pKa = 10.36SISHH7 pKa = 5.81PAEE10 pKa = 3.69RR11 pKa = 11.84QRR13 pKa = 11.84IRR15 pKa = 11.84GIGKK19 pKa = 9.45EE20 pKa = 3.72KK21 pKa = 10.55DD22 pKa = 3.12RR23 pKa = 11.84RR24 pKa = 11.84PTLDD28 pKa = 3.15QIKK31 pKa = 9.98EE32 pKa = 3.96RR33 pKa = 11.84QQLKK37 pKa = 10.2KK38 pKa = 10.63LKK40 pKa = 10.11KK41 pKa = 9.17KK42 pKa = 10.31RR43 pKa = 11.84NRR45 pKa = 11.84GKK47 pKa = 10.6
Molecular weight: 5.73 kDa
Isoelectric point according different methods:
Peptides (in silico digests for buttom-up proteomics)
Below you can find in silico digests of the whole proteome with Trypsin, Chymotrypsin, Trypsin+LysC, LysN, ArgC proteases suitable for different mass spec machines.| Try ESI |
 |
|---|
| ChTry ESI |
 |
|---|
| ArgC ESI |
 |
|---|
| LysN ESI |
 |
|---|
| TryLysC ESI |
 |
|---|
| Try MALDI |
 |
|---|
| ChTry MALDI |
 |
|---|
| ArgC MALDI |
 |
|---|
| LysN MALDI |
 |
|---|
| TryLysC MALDI |
 |
|---|
| Try LTQ |
 |
|---|
| ChTry LTQ |
 |
|---|
| ArgC LTQ |
 |
|---|
| LysN LTQ |
 |
|---|
| TryLysC LTQ |
 |
|---|
| Try MSlow |
 |
|---|
| ChTry MSlow |
 |
|---|
| ArgC MSlow |
 |
|---|
| LysN MSlow |
 |
|---|
| TryLysC MSlow |
 |
|---|
| Try MShigh |
 |
|---|
| ChTry MShigh |
 |
|---|
| ArgC MShigh |
 |
|---|
| LysN MShigh |
 |
|---|
| TryLysC MShigh |
 |
|---|
General Statistics
Number of major isoforms |
Number of additional isoforms |
Number of all proteins |
Number of amino acids |
Min. Seq. Length |
Max. Seq. Length |
Avg. Seq. Length |
Avg. Mol. Weight |
|---|---|---|---|---|---|---|---|
0 |
3135 |
38 |
493 |
174.2 |
20.2 |
Amino acid frequency
Ala |
Cys |
Asp |
Glu |
Phe |
Gly |
His |
Ile |
Lys |
Leu |
|---|---|---|---|---|---|---|---|---|---|
4.402 ± 0.266 | 0.734 ± 0.118 |
6.316 ± 0.459 | 7.049 ± 0.389 |
4.848 ± 0.523 | 4.306 ± 0.481 |
1.563 ± 0.226 | 8.804 ± 0.632 |
8.804 ± 0.447 | 10.654 ± 0.641 |
Met |
Asn |
Gln |
Pro |
Arg |
Ser |
Thr |
Val |
Trp |
Tyr |
|---|---|---|---|---|---|---|---|---|---|
1.914 ± 0.219 | 6.411 ± 0.355 |
3.158 ± 0.505 | 3.923 ± 0.367 |
4.147 ± 0.523 | 6.124 ± 0.482 |
5.869 ± 0.608 | 5.008 ± 0.489 |
0.957 ± 0.219 | 5.008 ± 0.236 |
Most of the basic statistics you can see at this page can be downloaded from this CSV file
Proteome-pI is available under Creative Commons Attribution-NoDerivs license, for more details see here
| Reference: Kozlowski LP. Proteome-pI 2.0: Proteome Isoelectric Point Database Update. Nucleic Acids Res. 2021, doi: 10.1093/nar/gkab944 | Contact: Lukasz P. Kozlowski |
