Pseudopuniceibacterium sediminis
Taxonomy: cellular organisms; Bacteria; Proteobacteria; Alphaproteobacteria; Rhodobacterales; Rhodobacteraceae; Pseudopuniceibacterium
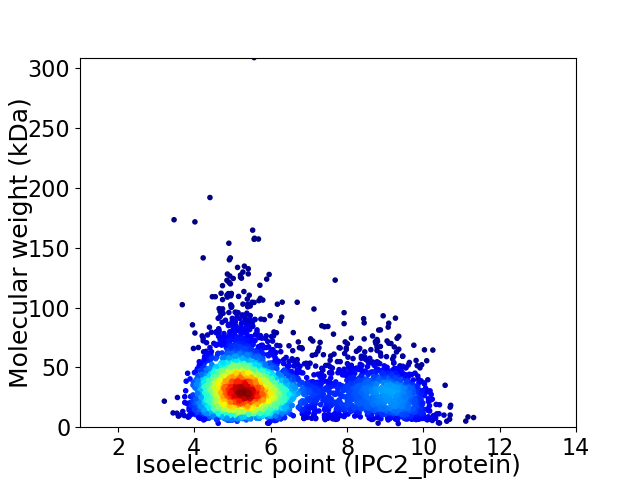
Average proteome isoelectric point is 6.21
Get precalculated fractions of proteins

Virtual 2D-PAGE plot for 3986 proteins (isoelectric point calculated using IPC2_protein)
Get csv file with sequences according to given criteria:
* You can choose from 21 different methods for calculating isoelectric point
Summary statistics related to proteome-wise predictions


Protein with the lowest isoelectric point:
>tr|A0A399J462|A0A399J462_9RHOB Nicotinate phosphoribosyltransferase OS=Pseudopuniceibacterium sediminis OX=2211117 GN=pncB PE=3 SV=1
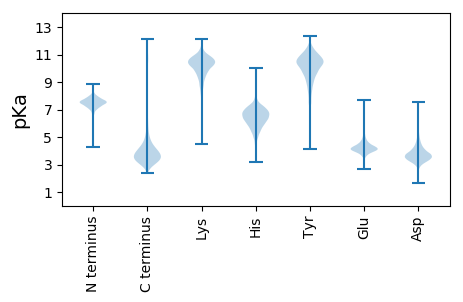
MM1 pKa = 7.48ILCTTRR7 pKa = 11.84FAKK10 pKa = 9.86IRR12 pKa = 11.84PTARR16 pKa = 11.84VGLGVACALTLSLCGPAAMAEE37 pKa = 4.09QKK39 pKa = 9.69TDD41 pKa = 4.38FKK43 pKa = 11.23LAWTIYY49 pKa = 9.43AGWMPWGYY57 pKa = 10.22IEE59 pKa = 5.18TSGIMDD65 pKa = 3.89KK66 pKa = 10.61WADD69 pKa = 3.4KK70 pKa = 11.31YY71 pKa = 11.2GITVDD76 pKa = 3.47IVQLNDD82 pKa = 3.23YY83 pKa = 10.37VEE85 pKa = 5.22SINQYY90 pKa = 8.14TAGAFDD96 pKa = 4.9GVTATNMDD104 pKa = 4.33ALSIPAGGGVDD115 pKa = 3.6STALIVGDD123 pKa = 3.76YY124 pKa = 11.35SNGNDD129 pKa = 3.81AIIVKK134 pKa = 10.28GDD136 pKa = 3.14VGLADD141 pKa = 4.1LAGKK145 pKa = 9.51SVNLVEE151 pKa = 5.48LSVSHH156 pKa = 6.06YY157 pKa = 10.83LLARR161 pKa = 11.84ALEE164 pKa = 4.13QVDD167 pKa = 4.88LSEE170 pKa = 5.45ADD172 pKa = 3.45LGAVINTSDD181 pKa = 4.2ADD183 pKa = 3.85MIAAFQTDD191 pKa = 3.72DD192 pKa = 3.86VEE194 pKa = 6.07VVVTWNPLVSTILEE208 pKa = 4.47DD209 pKa = 3.78PGATKK214 pKa = 10.51VYY216 pKa = 10.06DD217 pKa = 3.56SSDD220 pKa = 3.3IPGEE224 pKa = 4.2IIDD227 pKa = 4.39CLFVNTDD234 pKa = 3.46TLADD238 pKa = 3.46NPAFGKK244 pKa = 10.51AVTGAWYY251 pKa = 8.26EE252 pKa = 4.33TMALMASGTPEE263 pKa = 3.72GDD265 pKa = 3.23AALSEE270 pKa = 4.29MAEE273 pKa = 3.99ASGTDD278 pKa = 3.36LEE280 pKa = 5.16GYY282 pKa = 9.91KK283 pKa = 10.31SQLAATAMFYY293 pKa = 10.12TPKK296 pKa = 10.63AAMEE300 pKa = 4.18FTEE303 pKa = 4.88GASLQTTMVSVANFLFDD320 pKa = 4.46KK321 pKa = 11.1GILGEE326 pKa = 4.43GAPSPDD332 pKa = 3.94YY333 pKa = 11.45VGVAYY338 pKa = 9.61PDD340 pKa = 3.78GATTGDD346 pKa = 3.47AGNVNLRR353 pKa = 11.84YY354 pKa = 8.38DD355 pKa = 3.6TTYY358 pKa = 11.13VAMAVDD364 pKa = 4.42GTLL367 pKa = 3.25
MM1 pKa = 7.48ILCTTRR7 pKa = 11.84FAKK10 pKa = 9.86IRR12 pKa = 11.84PTARR16 pKa = 11.84VGLGVACALTLSLCGPAAMAEE37 pKa = 4.09QKK39 pKa = 9.69TDD41 pKa = 4.38FKK43 pKa = 11.23LAWTIYY49 pKa = 9.43AGWMPWGYY57 pKa = 10.22IEE59 pKa = 5.18TSGIMDD65 pKa = 3.89KK66 pKa = 10.61WADD69 pKa = 3.4KK70 pKa = 11.31YY71 pKa = 11.2GITVDD76 pKa = 3.47IVQLNDD82 pKa = 3.23YY83 pKa = 10.37VEE85 pKa = 5.22SINQYY90 pKa = 8.14TAGAFDD96 pKa = 4.9GVTATNMDD104 pKa = 4.33ALSIPAGGGVDD115 pKa = 3.6STALIVGDD123 pKa = 3.76YY124 pKa = 11.35SNGNDD129 pKa = 3.81AIIVKK134 pKa = 10.28GDD136 pKa = 3.14VGLADD141 pKa = 4.1LAGKK145 pKa = 9.51SVNLVEE151 pKa = 5.48LSVSHH156 pKa = 6.06YY157 pKa = 10.83LLARR161 pKa = 11.84ALEE164 pKa = 4.13QVDD167 pKa = 4.88LSEE170 pKa = 5.45ADD172 pKa = 3.45LGAVINTSDD181 pKa = 4.2ADD183 pKa = 3.85MIAAFQTDD191 pKa = 3.72DD192 pKa = 3.86VEE194 pKa = 6.07VVVTWNPLVSTILEE208 pKa = 4.47DD209 pKa = 3.78PGATKK214 pKa = 10.51VYY216 pKa = 10.06DD217 pKa = 3.56SSDD220 pKa = 3.3IPGEE224 pKa = 4.2IIDD227 pKa = 4.39CLFVNTDD234 pKa = 3.46TLADD238 pKa = 3.46NPAFGKK244 pKa = 10.51AVTGAWYY251 pKa = 8.26EE252 pKa = 4.33TMALMASGTPEE263 pKa = 3.72GDD265 pKa = 3.23AALSEE270 pKa = 4.29MAEE273 pKa = 3.99ASGTDD278 pKa = 3.36LEE280 pKa = 5.16GYY282 pKa = 9.91KK283 pKa = 10.31SQLAATAMFYY293 pKa = 10.12TPKK296 pKa = 10.63AAMEE300 pKa = 4.18FTEE303 pKa = 4.88GASLQTTMVSVANFLFDD320 pKa = 4.46KK321 pKa = 11.1GILGEE326 pKa = 4.43GAPSPDD332 pKa = 3.94YY333 pKa = 11.45VGVAYY338 pKa = 9.61PDD340 pKa = 3.78GATTGDD346 pKa = 3.47AGNVNLRR353 pKa = 11.84YY354 pKa = 8.38DD355 pKa = 3.6TTYY358 pKa = 11.13VAMAVDD364 pKa = 4.42GTLL367 pKa = 3.25
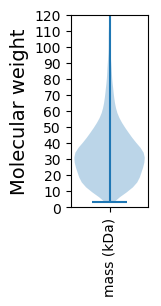
Molecular weight: 38.5 kDa
Isoelectric point according different methods:
Protein with the highest isoelectric point:
>tr|A0A399IVK0|A0A399IVK0_9RHOB D-glutamate deacylase OS=Pseudopuniceibacterium sediminis OX=2211117 GN=DL237_19210 PE=4 SV=1
MM1 pKa = 7.64PVFLFGSARR10 pKa = 11.84FRR12 pKa = 11.84QVRR15 pKa = 11.84FRR17 pKa = 11.84QVRR20 pKa = 11.84FGSARR25 pKa = 11.84FGSARR30 pKa = 11.84FGSARR35 pKa = 11.84FGSARR40 pKa = 11.84FGSARR45 pKa = 11.84FGSARR50 pKa = 11.84FGSAKK55 pKa = 10.16FGSAKK60 pKa = 10.21FGSAKK65 pKa = 9.51FRR67 pKa = 11.84QVSRR71 pKa = 11.84AGSS74 pKa = 3.24
MM1 pKa = 7.64PVFLFGSARR10 pKa = 11.84FRR12 pKa = 11.84QVRR15 pKa = 11.84FRR17 pKa = 11.84QVRR20 pKa = 11.84FGSARR25 pKa = 11.84FGSARR30 pKa = 11.84FGSARR35 pKa = 11.84FGSARR40 pKa = 11.84FGSARR45 pKa = 11.84FGSARR50 pKa = 11.84FGSAKK55 pKa = 10.16FGSAKK60 pKa = 10.21FGSAKK65 pKa = 9.51FRR67 pKa = 11.84QVSRR71 pKa = 11.84AGSS74 pKa = 3.24
Molecular weight: 8.07 kDa
Isoelectric point according different methods:
Peptides (in silico digests for buttom-up proteomics)
Below you can find in silico digests of the whole proteome with Trypsin, Chymotrypsin, Trypsin+LysC, LysN, ArgC proteases suitable for different mass spec machines.| Try ESI |
 |
|---|
| ChTry ESI |
 |
|---|
| ArgC ESI |
 |
|---|
| LysN ESI |
 |
|---|
| TryLysC ESI |
 |
|---|
| Try MALDI |
 |
|---|
| ChTry MALDI |
 |
|---|
| ArgC MALDI |
 |
|---|
| LysN MALDI |
 |
|---|
| TryLysC MALDI |
 |
|---|
| Try LTQ |
 |
|---|
| ChTry LTQ |
 |
|---|
| ArgC LTQ |
 |
|---|
| LysN LTQ |
 |
|---|
| TryLysC LTQ |
 |
|---|
| Try MSlow |
 |
|---|
| ChTry MSlow |
 |
|---|
| ArgC MSlow |
 |
|---|
| LysN MSlow |
 |
|---|
| TryLysC MSlow |
 |
|---|
| Try MShigh |
 |
|---|
| ChTry MShigh |
 |
|---|
| ArgC MShigh |
 |
|---|
| LysN MShigh |
 |
|---|
| TryLysC MShigh |
 |
|---|
General Statistics
Number of major isoforms |
Number of additional isoforms |
Number of all proteins |
Number of amino acids |
Min. Seq. Length |
Max. Seq. Length |
Avg. Seq. Length |
Avg. Mol. Weight |
|---|---|---|---|---|---|---|---|
0 |
1282358 |
28 |
2798 |
321.7 |
34.83 |
Amino acid frequency
Ala |
Cys |
Asp |
Glu |
Phe |
Gly |
His |
Ile |
Lys |
Leu |
|---|---|---|---|---|---|---|---|---|---|
12.562 ± 0.055 | 0.875 ± 0.012 |
6.068 ± 0.033 | 5.49 ± 0.039 |
3.624 ± 0.029 | 8.741 ± 0.036 |
2.043 ± 0.021 | 5.178 ± 0.03 |
2.844 ± 0.03 | 10.227 ± 0.046 |
Met |
Asn |
Gln |
Pro |
Arg |
Ser |
Thr |
Val |
Trp |
Tyr |
|---|---|---|---|---|---|---|---|---|---|
2.881 ± 0.021 | 2.456 ± 0.024 |
5.199 ± 0.031 | 3.284 ± 0.026 |
6.879 ± 0.038 | 5.273 ± 0.029 |
5.585 ± 0.032 | 7.245 ± 0.027 |
1.349 ± 0.017 | 2.197 ± 0.02 |
Most of the basic statistics you can see at this page can be downloaded from this CSV file
Proteome-pI is available under Creative Commons Attribution-NoDerivs license, for more details see here
| Reference: Kozlowski LP. Proteome-pI 2.0: Proteome Isoelectric Point Database Update. Nucleic Acids Res. 2021, doi: 10.1093/nar/gkab944 | Contact: Lukasz P. Kozlowski |
