Capybara microvirus Cap1_SP_175
Taxonomy: Viruses; Monodnaviria; Sangervirae; Phixviricota; Malgrandaviricetes; Petitvirales; Microviridae; unclassified Microviridae
Average proteome isoelectric point is 6.3
Get precalculated fractions of proteins

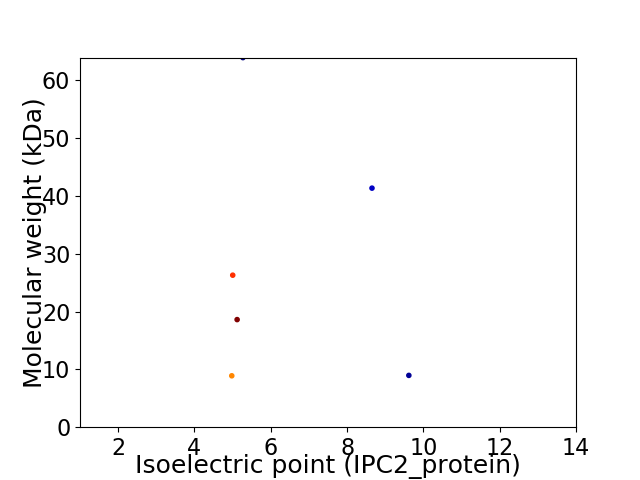
Virtual 2D-PAGE plot for 6 proteins (isoelectric point calculated using IPC2_protein)
Get csv file with sequences according to given criteria:
* You can choose from 21 different methods for calculating isoelectric point
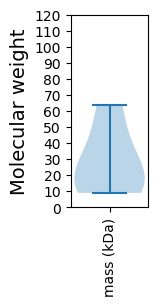
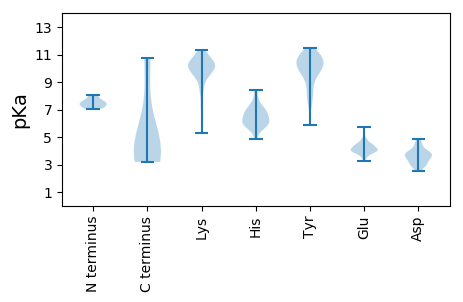
Summary statistics related to proteome-wise predictions


Protein with the lowest isoelectric point:
>tr|A0A4V1FVQ7|A0A4V1FVQ7_9VIRU Minor capsid protein OS=Capybara microvirus Cap1_SP_175 OX=2585404 PE=4 SV=1
MM1 pKa = 7.44KK2 pKa = 10.17GEE4 pKa = 4.04KK5 pKa = 8.49MGNVIGTVIGGLASNVSNATQGALSDD31 pKa = 3.73SSSWGGGVSNSSSSSWEE48 pKa = 4.05SGGSSSMNSASSAEE62 pKa = 4.41DD63 pKa = 2.91AWSQAISNSWTEE75 pKa = 3.94ANEE78 pKa = 3.94ANQNAAYY85 pKa = 9.56AAYY88 pKa = 10.04VANQLQDD95 pKa = 2.52KK96 pKa = 9.43WYY98 pKa = 7.84QQQMEE103 pKa = 4.57YY104 pKa = 10.76NRR106 pKa = 11.84QEE108 pKa = 3.99AQNQRR113 pKa = 11.84DD114 pKa = 3.72FEE116 pKa = 4.28EE117 pKa = 5.13RR118 pKa = 11.84MSSTAYY124 pKa = 9.76QRR126 pKa = 11.84AVNDD130 pKa = 4.06LKK132 pKa = 11.26AAGLNPILAATLGGSSTPSTSAASISSPTAKK163 pKa = 10.68AADD166 pKa = 3.86TYY168 pKa = 10.03MNSYY172 pKa = 10.76SSAKK176 pKa = 10.04SASQSTGRR184 pKa = 11.84SYY186 pKa = 11.43SYY188 pKa = 11.43GEE190 pKa = 4.48SSSGWSGGSEE200 pKa = 4.26STSHH204 pKa = 6.34SLEE207 pKa = 4.24MNKK210 pKa = 8.57STSHH214 pKa = 5.87YY215 pKa = 10.49EE216 pKa = 4.07SGLSTGLKK224 pKa = 10.51LLGQTEE230 pKa = 4.48LTNGNALTTAADD242 pKa = 3.59ALRR245 pKa = 11.84YY246 pKa = 9.01SAAVGYY252 pKa = 10.15RR253 pKa = 3.19
MM1 pKa = 7.44KK2 pKa = 10.17GEE4 pKa = 4.04KK5 pKa = 8.49MGNVIGTVIGGLASNVSNATQGALSDD31 pKa = 3.73SSSWGGGVSNSSSSSWEE48 pKa = 4.05SGGSSSMNSASSAEE62 pKa = 4.41DD63 pKa = 2.91AWSQAISNSWTEE75 pKa = 3.94ANEE78 pKa = 3.94ANQNAAYY85 pKa = 9.56AAYY88 pKa = 10.04VANQLQDD95 pKa = 2.52KK96 pKa = 9.43WYY98 pKa = 7.84QQQMEE103 pKa = 4.57YY104 pKa = 10.76NRR106 pKa = 11.84QEE108 pKa = 3.99AQNQRR113 pKa = 11.84DD114 pKa = 3.72FEE116 pKa = 4.28EE117 pKa = 5.13RR118 pKa = 11.84MSSTAYY124 pKa = 9.76QRR126 pKa = 11.84AVNDD130 pKa = 4.06LKK132 pKa = 11.26AAGLNPILAATLGGSSTPSTSAASISSPTAKK163 pKa = 10.68AADD166 pKa = 3.86TYY168 pKa = 10.03MNSYY172 pKa = 10.76SSAKK176 pKa = 10.04SASQSTGRR184 pKa = 11.84SYY186 pKa = 11.43SYY188 pKa = 11.43GEE190 pKa = 4.48SSSGWSGGSEE200 pKa = 4.26STSHH204 pKa = 6.34SLEE207 pKa = 4.24MNKK210 pKa = 8.57STSHH214 pKa = 5.87YY215 pKa = 10.49EE216 pKa = 4.07SGLSTGLKK224 pKa = 10.51LLGQTEE230 pKa = 4.48LTNGNALTTAADD242 pKa = 3.59ALRR245 pKa = 11.84YY246 pKa = 9.01SAAVGYY252 pKa = 10.15RR253 pKa = 3.19
Molecular weight: 26.29 kDa
Isoelectric point according different methods:
Protein with the highest isoelectric point:
>tr|A0A4P8W4G9|A0A4P8W4G9_9VIRU Nonstructural protein OS=Capybara microvirus Cap1_SP_175 OX=2585404 PE=4 SV=1
MM1 pKa = 7.55RR2 pKa = 11.84RR3 pKa = 11.84IVKK6 pKa = 9.74KK7 pKa = 10.72KK8 pKa = 10.12KK9 pKa = 9.89GATKK13 pKa = 9.5MIEE16 pKa = 4.02MPEE19 pKa = 3.98FTNKK23 pKa = 8.24YY24 pKa = 5.9TAQQISDD31 pKa = 3.06ITGISKK37 pKa = 8.72RR38 pKa = 11.84TIEE41 pKa = 3.61RR42 pKa = 11.84WRR44 pKa = 11.84RR45 pKa = 11.84SGIPGNMEE53 pKa = 3.49GMKK56 pKa = 10.12YY57 pKa = 10.16QYY59 pKa = 11.41LLTKK63 pKa = 10.78LLLTGNKK70 pKa = 9.53EE71 pKa = 3.94IIIKK75 pKa = 10.81GEE77 pKa = 3.74
MM1 pKa = 7.55RR2 pKa = 11.84RR3 pKa = 11.84IVKK6 pKa = 9.74KK7 pKa = 10.72KK8 pKa = 10.12KK9 pKa = 9.89GATKK13 pKa = 9.5MIEE16 pKa = 4.02MPEE19 pKa = 3.98FTNKK23 pKa = 8.24YY24 pKa = 5.9TAQQISDD31 pKa = 3.06ITGISKK37 pKa = 8.72RR38 pKa = 11.84TIEE41 pKa = 3.61RR42 pKa = 11.84WRR44 pKa = 11.84RR45 pKa = 11.84SGIPGNMEE53 pKa = 3.49GMKK56 pKa = 10.12YY57 pKa = 10.16QYY59 pKa = 11.41LLTKK63 pKa = 10.78LLLTGNKK70 pKa = 9.53EE71 pKa = 3.94IIIKK75 pKa = 10.81GEE77 pKa = 3.74
Molecular weight: 8.96 kDa
Isoelectric point according different methods:
Peptides (in silico digests for buttom-up proteomics)
Below you can find in silico digests of the whole proteome with Trypsin, Chymotrypsin, Trypsin+LysC, LysN, ArgC proteases suitable for different mass spec machines.| Try ESI |
 |
|---|
| ChTry ESI |
 |
|---|
| ArgC ESI |
 |
|---|
| LysN ESI |
 |
|---|
| TryLysC ESI |
 |
|---|
| Try MALDI |
 |
|---|
| ChTry MALDI |
 |
|---|
| ArgC MALDI |
 |
|---|
| LysN MALDI |
 |
|---|
| TryLysC MALDI |
 |
|---|
| Try LTQ |
 |
|---|
| ChTry LTQ |
 |
|---|
| ArgC LTQ |
 |
|---|
| LysN LTQ |
 |
|---|
| TryLysC LTQ |
 |
|---|
| Try MSlow |
 |
|---|
| ChTry MSlow |
 |
|---|
| ArgC MSlow |
 |
|---|
| LysN MSlow |
 |
|---|
| TryLysC MSlow |
 |
|---|
| Try MShigh |
 |
|---|
| ChTry MShigh |
 |
|---|
| ArgC MShigh |
 |
|---|
| LysN MShigh |
 |
|---|
| TryLysC MShigh |
 |
|---|
General Statistics
Number of major isoforms |
Number of additional isoforms |
Number of all proteins |
Number of amino acids |
Min. Seq. Length |
Max. Seq. Length |
Avg. Seq. Length |
Avg. Mol. Weight |
|---|---|---|---|---|---|---|---|
0 |
1468 |
77 |
556 |
244.7 |
28.01 |
Amino acid frequency
Ala |
Cys |
Asp |
Glu |
Phe |
Gly |
His |
Ile |
Lys |
Leu |
|---|---|---|---|---|---|---|---|---|---|
7.084 ± 1.373 | 0.954 ± 0.374 |
4.223 ± 0.526 | 8.243 ± 1.356 |
2.929 ± 0.753 | 6.471 ± 0.665 |
1.635 ± 0.367 | 7.084 ± 1.236 |
7.561 ± 2.241 | 5.45 ± 0.316 |
Met |
Asn |
Gln |
Pro |
Arg |
Ser |
Thr |
Val |
Trp |
Tyr |
|---|---|---|---|---|---|---|---|---|---|
3.406 ± 0.483 | 5.722 ± 0.46 |
3.883 ± 0.821 | 4.223 ± 0.448 |
4.564 ± 0.485 | 7.425 ± 2.463 |
7.357 ± 1.125 | 3.474 ± 1.038 |
2.316 ± 0.28 | 5.995 ± 0.559 |
Most of the basic statistics you can see at this page can be downloaded from this CSV file
Proteome-pI is available under Creative Commons Attribution-NoDerivs license, for more details see here
| Reference: Kozlowski LP. Proteome-pI 2.0: Proteome Isoelectric Point Database Update. Nucleic Acids Res. 2021, doi: 10.1093/nar/gkab944 | Contact: Lukasz P. Kozlowski |
