Rotavirus A human/Vanderbilt/VU08-09-12/2008/G3P[8]
Taxonomy: Viruses; Riboviria; Orthornavirae; Duplornaviricota; Resentoviricetes; Reovirales; Reoviridae; Sedoreovirinae; Rotavirus; Rotavirus A; Rotavirus G3
Average proteome isoelectric point is 6.4
Get precalculated fractions of proteins

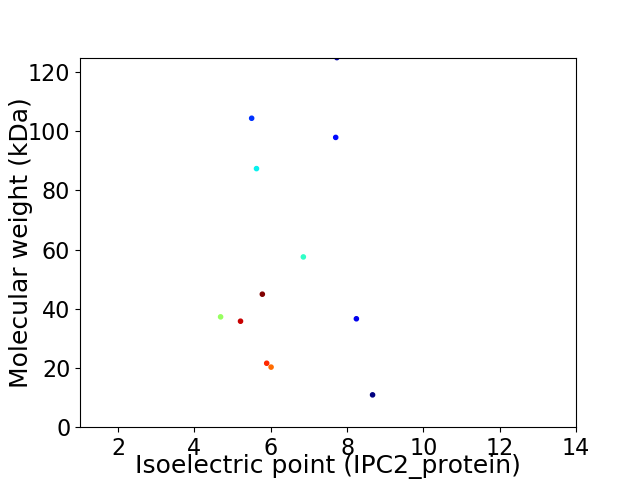
Virtual 2D-PAGE plot for 12 proteins (isoelectric point calculated using IPC2_protein)
Get csv file with sequences according to given criteria:
* You can choose from 21 different methods for calculating isoelectric point
Summary statistics related to proteome-wise predictions


Protein with the lowest isoelectric point:
>tr|F5C726|F5C726_9REOV Non-structural protein 3 OS=Rotavirus A human/Vanderbilt/VU08-09-12/2008/G3P[8] OX=1004874 GN=NSP3 PE=3 SV=1
MM1 pKa = 7.26YY2 pKa = 10.17GIEE5 pKa = 4.26YY6 pKa = 7.25TTVLTFLISVILLNYY21 pKa = 8.65VLKK24 pKa = 10.73SLTRR28 pKa = 11.84IMDD31 pKa = 4.04FIIYY35 pKa = 9.89RR36 pKa = 11.84FLLIIVILSPLLNAQNYY53 pKa = 8.26GINLPITGSMDD64 pKa = 3.38TPYY67 pKa = 10.73TNSTRR72 pKa = 11.84EE73 pKa = 4.09EE74 pKa = 4.15VFLTSTLCLYY84 pKa = 10.75YY85 pKa = 8.86PTEE88 pKa = 4.27AATEE92 pKa = 4.11INDD95 pKa = 3.85NSWKK99 pKa = 9.38DD100 pKa = 3.5TLSQLFLIKK109 pKa = 10.23GWPTGSIYY117 pKa = 10.71FKK119 pKa = 10.4DD120 pKa = 3.75YY121 pKa = 10.94TDD123 pKa = 3.33IASFSVDD130 pKa = 3.05PQLYY134 pKa = 9.83CDD136 pKa = 3.92YY137 pKa = 11.01NLVLMKK143 pKa = 10.45YY144 pKa = 10.21DD145 pKa = 3.39ATLQLDD151 pKa = 3.72MSEE154 pKa = 4.89LADD157 pKa = 3.93LLLNEE162 pKa = 4.55WLCNPMDD169 pKa = 3.29ITLYY173 pKa = 10.67YY174 pKa = 9.25YY175 pKa = 10.55QQTDD179 pKa = 3.57EE180 pKa = 4.17ANKK183 pKa = 8.08WISMGSSCTIKK194 pKa = 10.46VCPLNTQTLGIGCLTTDD211 pKa = 2.98TNTFEE216 pKa = 5.0EE217 pKa = 4.55IATAEE222 pKa = 4.24KK223 pKa = 10.76LVITDD228 pKa = 3.22VVDD231 pKa = 4.33GVNHH235 pKa = 6.78KK236 pKa = 11.16LNVTTNTCTIRR247 pKa = 11.84NCKK250 pKa = 9.83KK251 pKa = 10.18LGPRR255 pKa = 11.84EE256 pKa = 4.01NVAVIQVGGSDD267 pKa = 3.8VLDD270 pKa = 3.44ITADD274 pKa = 3.7PTTMPQTEE282 pKa = 3.54RR283 pKa = 11.84MMRR286 pKa = 11.84VNWKK290 pKa = 9.44KK291 pKa = 7.9WWQVFYY297 pKa = 10.66TIVDD301 pKa = 3.57YY302 pKa = 11.59VNQIVQAMSKK312 pKa = 10.19RR313 pKa = 11.84SRR315 pKa = 11.84SLNSAAFYY323 pKa = 11.0YY324 pKa = 10.27RR325 pKa = 11.84VV326 pKa = 3.19
MM1 pKa = 7.26YY2 pKa = 10.17GIEE5 pKa = 4.26YY6 pKa = 7.25TTVLTFLISVILLNYY21 pKa = 8.65VLKK24 pKa = 10.73SLTRR28 pKa = 11.84IMDD31 pKa = 4.04FIIYY35 pKa = 9.89RR36 pKa = 11.84FLLIIVILSPLLNAQNYY53 pKa = 8.26GINLPITGSMDD64 pKa = 3.38TPYY67 pKa = 10.73TNSTRR72 pKa = 11.84EE73 pKa = 4.09EE74 pKa = 4.15VFLTSTLCLYY84 pKa = 10.75YY85 pKa = 8.86PTEE88 pKa = 4.27AATEE92 pKa = 4.11INDD95 pKa = 3.85NSWKK99 pKa = 9.38DD100 pKa = 3.5TLSQLFLIKK109 pKa = 10.23GWPTGSIYY117 pKa = 10.71FKK119 pKa = 10.4DD120 pKa = 3.75YY121 pKa = 10.94TDD123 pKa = 3.33IASFSVDD130 pKa = 3.05PQLYY134 pKa = 9.83CDD136 pKa = 3.92YY137 pKa = 11.01NLVLMKK143 pKa = 10.45YY144 pKa = 10.21DD145 pKa = 3.39ATLQLDD151 pKa = 3.72MSEE154 pKa = 4.89LADD157 pKa = 3.93LLLNEE162 pKa = 4.55WLCNPMDD169 pKa = 3.29ITLYY173 pKa = 10.67YY174 pKa = 9.25YY175 pKa = 10.55QQTDD179 pKa = 3.57EE180 pKa = 4.17ANKK183 pKa = 8.08WISMGSSCTIKK194 pKa = 10.46VCPLNTQTLGIGCLTTDD211 pKa = 2.98TNTFEE216 pKa = 5.0EE217 pKa = 4.55IATAEE222 pKa = 4.24KK223 pKa = 10.76LVITDD228 pKa = 3.22VVDD231 pKa = 4.33GVNHH235 pKa = 6.78KK236 pKa = 11.16LNVTTNTCTIRR247 pKa = 11.84NCKK250 pKa = 9.83KK251 pKa = 10.18LGPRR255 pKa = 11.84EE256 pKa = 4.01NVAVIQVGGSDD267 pKa = 3.8VLDD270 pKa = 3.44ITADD274 pKa = 3.7PTTMPQTEE282 pKa = 3.54RR283 pKa = 11.84MMRR286 pKa = 11.84VNWKK290 pKa = 9.44KK291 pKa = 7.9WWQVFYY297 pKa = 10.66TIVDD301 pKa = 3.57YY302 pKa = 11.59VNQIVQAMSKK312 pKa = 10.19RR313 pKa = 11.84SRR315 pKa = 11.84SLNSAAFYY323 pKa = 11.0YY324 pKa = 10.27RR325 pKa = 11.84VV326 pKa = 3.19
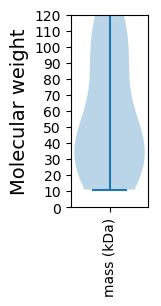
Molecular weight: 37.27 kDa
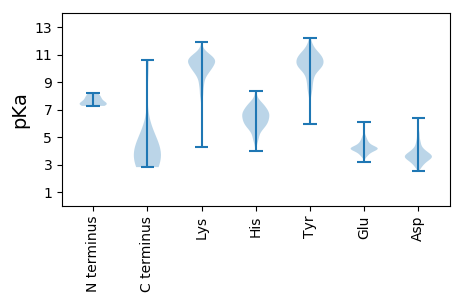
Isoelectric point according different methods:
Protein with the highest isoelectric point:
>tr|F5C724|F5C724_9REOV Non-structural glycoprotein 4 OS=Rotavirus A human/Vanderbilt/VU08-09-12/2008/G3P[8] OX=1004874 GN=NSP4 PE=3 SV=1
MM1 pKa = 7.27NRR3 pKa = 11.84LLQRR7 pKa = 11.84QLFLEE12 pKa = 4.14NLLVGVNSTFHH23 pKa = 6.05QMQKK27 pKa = 10.71HH28 pKa = 6.2SISTCCRR35 pKa = 11.84SLQRR39 pKa = 11.84ILDD42 pKa = 3.95HH43 pKa = 7.28LILLQTIHH51 pKa = 6.63SPAFRR56 pKa = 11.84LDD58 pKa = 3.35RR59 pKa = 11.84MQLRR63 pKa = 11.84QMQTLACLWIHH74 pKa = 6.26RR75 pKa = 11.84HH76 pKa = 4.7NHH78 pKa = 6.09DD79 pKa = 4.37LQATLDD85 pKa = 4.4AINWISPP92 pKa = 3.43
MM1 pKa = 7.27NRR3 pKa = 11.84LLQRR7 pKa = 11.84QLFLEE12 pKa = 4.14NLLVGVNSTFHH23 pKa = 6.05QMQKK27 pKa = 10.71HH28 pKa = 6.2SISTCCRR35 pKa = 11.84SLQRR39 pKa = 11.84ILDD42 pKa = 3.95HH43 pKa = 7.28LILLQTIHH51 pKa = 6.63SPAFRR56 pKa = 11.84LDD58 pKa = 3.35RR59 pKa = 11.84MQLRR63 pKa = 11.84QMQTLACLWIHH74 pKa = 6.26RR75 pKa = 11.84HH76 pKa = 4.7NHH78 pKa = 6.09DD79 pKa = 4.37LQATLDD85 pKa = 4.4AINWISPP92 pKa = 3.43
Molecular weight: 10.92 kDa
Isoelectric point according different methods:
Peptides (in silico digests for buttom-up proteomics)
Below you can find in silico digests of the whole proteome with Trypsin, Chymotrypsin, Trypsin+LysC, LysN, ArgC proteases suitable for different mass spec machines.| Try ESI |
 |
|---|
| ChTry ESI |
 |
|---|
| ArgC ESI |
 |
|---|
| LysN ESI |
 |
|---|
| TryLysC ESI |
 |
|---|
| Try MALDI |
 |
|---|
| ChTry MALDI |
 |
|---|
| ArgC MALDI |
 |
|---|
| LysN MALDI |
 |
|---|
| TryLysC MALDI |
 |
|---|
| Try LTQ |
 |
|---|
| ChTry LTQ |
 |
|---|
| ArgC LTQ |
 |
|---|
| LysN LTQ |
 |
|---|
| TryLysC LTQ |
 |
|---|
| Try MSlow |
 |
|---|
| ChTry MSlow |
 |
|---|
| ArgC MSlow |
 |
|---|
| LysN MSlow |
 |
|---|
| TryLysC MSlow |
 |
|---|
| Try MShigh |
 |
|---|
| ChTry MShigh |
 |
|---|
| ArgC MShigh |
 |
|---|
| LysN MShigh |
 |
|---|
| TryLysC MShigh |
 |
|---|
General Statistics
Number of major isoforms |
Number of additional isoforms |
Number of all proteins |
Number of amino acids |
Min. Seq. Length |
Max. Seq. Length |
Avg. Seq. Length |
Avg. Mol. Weight |
|---|---|---|---|---|---|---|---|
0 |
5892 |
92 |
1088 |
491.0 |
56.62 |
Amino acid frequency
Ala |
Cys |
Asp |
Glu |
Phe |
Gly |
His |
Ile |
Lys |
Leu |
|---|---|---|---|---|---|---|---|---|---|
4.82 ± 0.369 | 1.256 ± 0.383 |
6.127 ± 0.33 | 5.244 ± 0.255 |
4.294 ± 0.306 | 3.377 ± 0.291 |
1.612 ± 0.224 | 8.164 ± 0.298 |
6.5 ± 0.56 | 9.318 ± 0.437 |
Met |
Asn |
Gln |
Pro |
Arg |
Ser |
Thr |
Val |
Trp |
Tyr |
|---|---|---|---|---|---|---|---|---|---|
3.004 ± 0.264 | 7.451 ± 0.451 |
3.225 ± 0.228 | 4.345 ± 0.56 |
4.667 ± 0.357 | 7.824 ± 0.795 |
6.466 ± 0.49 | 6.195 ± 0.226 |
1.154 ± 0.138 | 4.956 ± 0.549 |
Most of the basic statistics you can see at this page can be downloaded from this CSV file
Proteome-pI is available under Creative Commons Attribution-NoDerivs license, for more details see here
| Reference: Kozlowski LP. Proteome-pI 2.0: Proteome Isoelectric Point Database Update. Nucleic Acids Res. 2021, doi: 10.1093/nar/gkab944 | Contact: Lukasz P. Kozlowski |
