Mycobacterium phage Spud
Taxonomy: Viruses; Duplodnaviria; Heunggongvirae; Uroviricota; Caudoviricetes; Caudovirales; Myoviridae; Bixzunavirus; Mycobacterium virus Bxz1
Average proteome isoelectric point is 5.97
Get precalculated fractions of proteins
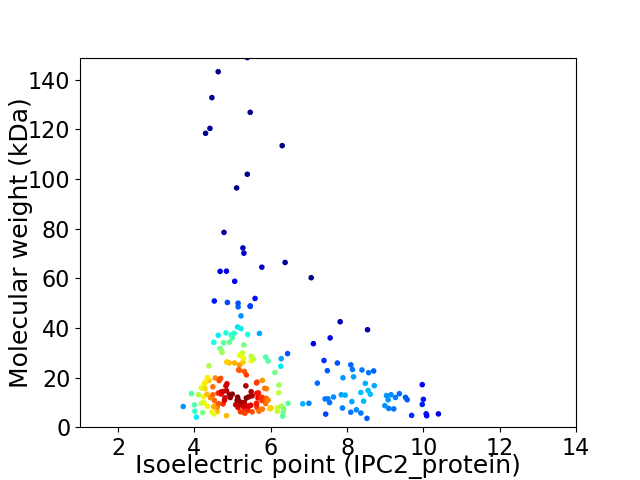
Virtual 2D-PAGE plot for 222 proteins (isoelectric point calculated using IPC2_protein)
Get csv file with sequences according to given criteria:
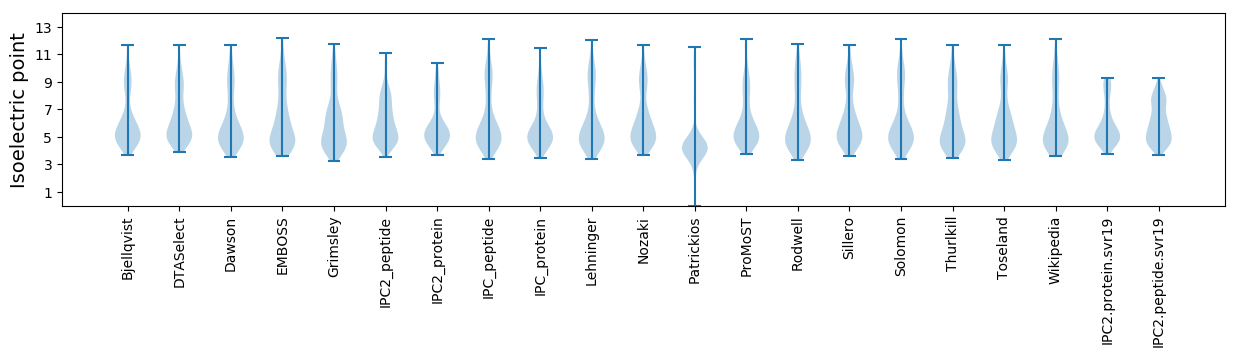
* You can choose from 21 different methods for calculating isoelectric point
Summary statistics related to proteome-wise predictions
Protein with the lowest isoelectric point:
>tr|B5LKP0|B5LKP0_9CAUD Minor tail protein OS=Mycobacterium phage Spud OX=546808 GN=135 PE=3 SV=1
MM1 pKa = 7.81ADD3 pKa = 3.58YY4 pKa = 11.13ASDD7 pKa = 4.1CPISRR12 pKa = 11.84PVDD15 pKa = 3.83PGWTSDD21 pKa = 2.87WDD23 pKa = 3.89LGGMQWSYY31 pKa = 11.65DD32 pKa = 3.36YY33 pKa = 11.9GMFYY37 pKa = 10.44QPSPDD42 pKa = 3.22EE43 pKa = 4.38LLPLRR48 pKa = 11.84KK49 pKa = 8.64PAQRR53 pKa = 11.84VGEE56 pKa = 4.11
MM1 pKa = 7.81ADD3 pKa = 3.58YY4 pKa = 11.13ASDD7 pKa = 4.1CPISRR12 pKa = 11.84PVDD15 pKa = 3.83PGWTSDD21 pKa = 2.87WDD23 pKa = 3.89LGGMQWSYY31 pKa = 11.65DD32 pKa = 3.36YY33 pKa = 11.9GMFYY37 pKa = 10.44QPSPDD42 pKa = 3.22EE43 pKa = 4.38LLPLRR48 pKa = 11.84KK49 pKa = 8.64PAQRR53 pKa = 11.84VGEE56 pKa = 4.11
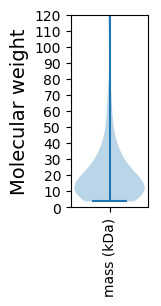
Molecular weight: 6.4 kDa
Isoelectric point according different methods:
Protein with the highest isoelectric point:
>tr|B5LKU4|B5LKU4_9CAUD Uncharacterized protein OS=Mycobacterium phage Spud OX=546808 GN=219 PE=4 SV=1
MM1 pKa = 7.51TKK3 pKa = 9.08TALRR7 pKa = 11.84ARR9 pKa = 11.84RR10 pKa = 11.84FHH12 pKa = 6.69HH13 pKa = 7.25LSGLQQTQIYY23 pKa = 9.87RR24 pKa = 11.84EE25 pKa = 3.9IEE27 pKa = 4.06KK28 pKa = 10.6AIEE31 pKa = 4.19PYY33 pKa = 10.19RR34 pKa = 11.84GLRR37 pKa = 11.84GLTARR42 pKa = 11.84TKK44 pKa = 8.62EE45 pKa = 4.31TMSVRR50 pKa = 11.84LARR53 pKa = 11.84KK54 pKa = 8.85FGVPRR59 pKa = 11.84KK60 pKa = 10.1VILDD64 pKa = 3.6VYY66 pKa = 9.38EE67 pKa = 3.74YY68 pKa = 10.65RR69 pKa = 11.84AAQRR73 pKa = 11.84HH74 pKa = 4.65EE75 pKa = 4.21RR76 pKa = 11.84EE77 pKa = 4.09
MM1 pKa = 7.51TKK3 pKa = 9.08TALRR7 pKa = 11.84ARR9 pKa = 11.84RR10 pKa = 11.84FHH12 pKa = 6.69HH13 pKa = 7.25LSGLQQTQIYY23 pKa = 9.87RR24 pKa = 11.84EE25 pKa = 3.9IEE27 pKa = 4.06KK28 pKa = 10.6AIEE31 pKa = 4.19PYY33 pKa = 10.19RR34 pKa = 11.84GLRR37 pKa = 11.84GLTARR42 pKa = 11.84TKK44 pKa = 8.62EE45 pKa = 4.31TMSVRR50 pKa = 11.84LARR53 pKa = 11.84KK54 pKa = 8.85FGVPRR59 pKa = 11.84KK60 pKa = 10.1VILDD64 pKa = 3.6VYY66 pKa = 9.38EE67 pKa = 3.74YY68 pKa = 10.65RR69 pKa = 11.84AAQRR73 pKa = 11.84HH74 pKa = 4.65EE75 pKa = 4.21RR76 pKa = 11.84EE77 pKa = 4.09
Molecular weight: 9.18 kDa
Isoelectric point according different methods:
Peptides (in silico digests for buttom-up proteomics)
Below you can find in silico digests of the whole proteome with Trypsin, Chymotrypsin, Trypsin+LysC, LysN, ArgC proteases suitable for different mass spec machines.| Try ESI |
 |
|---|
| ChTry ESI |
|
|---|
| ArgC ESI |
|
|---|
| LysN ESI |
|
|---|
| TryLysC ESI |
|
|---|
| Try MALDI |
|
|---|
| ChTry MALDI |
|
|---|
| ArgC MALDI |
|
|---|
| LysN MALDI |
|
|---|
| TryLysC MALDI |
|
|---|
| Try LTQ |
|
|---|
| ChTry LTQ |
|
|---|
| ArgC LTQ |
|
|---|
| LysN LTQ |
|
|---|
| TryLysC LTQ |
|
|---|
| Try MSlow |
|
|---|
| ChTry MSlow |
|
|---|
| ArgC MSlow |
|
|---|
| LysN MSlow |
|
|---|
| TryLysC MSlow |
|
|---|
| Try MShigh |
|
|---|
| ChTry MShigh |
|
|---|
| ArgC MShigh |
|
|---|
| LysN MShigh |
|
|---|
| TryLysC MShigh |
|
|---|
General Statistics
Number of major isoforms |
Number of additional isoforms |
Number of all proteins |
Number of amino acids |
Min. Seq. Length |
Max. Seq. Length |
Avg. Seq. Length |
Avg. Mol. Weight |
|---|---|---|---|---|---|---|---|
0 |
47025 |
31 |
1369 |
211.8 |
23.46 |
Amino acid frequency
Ala |
Cys |
Asp |
Glu |
Phe |
Gly |
His |
Ile |
Lys |
Leu |
|---|---|---|---|---|---|---|---|---|---|
9.748 ± 0.234 | 0.855 ± 0.073 |
7.103 ± 0.176 | 6.446 ± 0.196 |
3.105 ± 0.096 | 8.045 ± 0.263 |
2.465 ± 0.119 | 4.279 ± 0.131 |
3.779 ± 0.123 | 7.617 ± 0.224 |
Met |
Asn |
Gln |
Pro |
Arg |
Ser |
Thr |
Val |
Trp |
Tyr |
|---|---|---|---|---|---|---|---|---|---|
2.511 ± 0.102 | 3.407 ± 0.105 |
5.686 ± 0.166 | 4.164 ± 0.118 |
6.845 ± 0.177 | 5.423 ± 0.162 |
6.431 ± 0.18 | 7.158 ± 0.194 |
1.89 ± 0.08 | 3.045 ± 0.086 |
Most of the basic statistics you can see at this page can be downloaded from this CSV file
See this proteome in:

Proteome-pI is available under Creative Commons Attribution-NoDerivs license, for more details see here
| Reference: Kozlowski LP. Proteome-pI 2.0: Proteome Isoelectric Point Database Update. Nucleic Acids Res. 2021, doi: 10.1093/nar/gkab944 | Contact: Lukasz P. Kozlowski |