Arthrobacter phage Shepard
Taxonomy: Viruses; Duplodnaviria; Heunggongvirae; Uroviricota; Caudoviricetes; Caudovirales; Siphoviridae; Gordonvirus; unclassified Gordonvirus
Average proteome isoelectric point is 6.78
Get precalculated fractions of proteins

Virtual 2D-PAGE plot for 92 proteins (isoelectric point calculated using IPC2_protein)
Get csv file with sequences according to given criteria:
* You can choose from 21 different methods for calculating isoelectric point
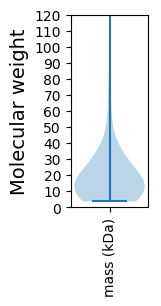
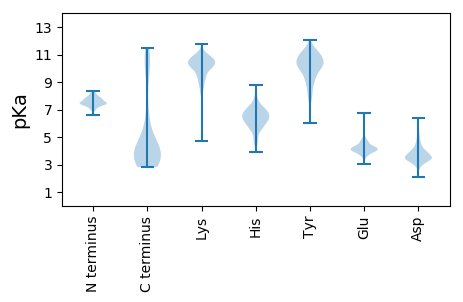
Summary statistics related to proteome-wise predictions


Protein with the lowest isoelectric point:
>tr|A0A5J6TUT9|A0A5J6TUT9_9CAUD Uncharacterized protein OS=Arthrobacter phage Shepard OX=2599833 GN=38 PE=4 SV=1
MM1 pKa = 7.49TKK3 pKa = 10.38LAWDD7 pKa = 3.56AVGEE11 pKa = 4.25RR12 pKa = 11.84FFEE15 pKa = 4.56AGADD19 pKa = 3.55RR20 pKa = 11.84GVLYY24 pKa = 10.61LDD26 pKa = 5.28DD27 pKa = 5.7VGHH30 pKa = 6.92PWNGLVAVEE39 pKa = 4.22QSPSGGEE46 pKa = 3.82PEE48 pKa = 4.84TYY50 pKa = 10.31YY51 pKa = 10.89QDD53 pKa = 3.56GLPYY57 pKa = 9.95ISVSASEE64 pKa = 4.22EE65 pKa = 4.0FKK67 pKa = 11.3GSIEE71 pKa = 4.41AYY73 pKa = 8.28TYY75 pKa = 9.79PNAFAVCDD83 pKa = 4.23GSSEE87 pKa = 4.2IAQGMYY93 pKa = 10.63LSQQDD98 pKa = 3.7RR99 pKa = 11.84KK100 pKa = 10.39PFGLSYY106 pKa = 9.84RR107 pKa = 11.84TLIGNDD113 pKa = 2.96IQEE116 pKa = 4.58LEE118 pKa = 4.32FGYY121 pKa = 10.14KK122 pKa = 8.87IHH124 pKa = 7.73IIYY127 pKa = 10.62NCMASPSSRR136 pKa = 11.84SYY138 pKa = 11.47SSLGEE143 pKa = 3.9SDD145 pKa = 3.4NAEE148 pKa = 4.04TFNWSITTRR157 pKa = 11.84PVKK160 pKa = 10.76FEE162 pKa = 4.5DD163 pKa = 3.22VTFGIKK169 pKa = 10.21YY170 pKa = 8.8GAHH173 pKa = 4.98VTLDD177 pKa = 3.4SRR179 pKa = 11.84EE180 pKa = 4.09VYY182 pKa = 8.57PWAMAAVEE190 pKa = 4.1EE191 pKa = 4.42VLYY194 pKa = 8.91GTDD197 pKa = 3.12EE198 pKa = 4.32TEE200 pKa = 4.09ARR202 pKa = 11.84LPTPQEE208 pKa = 3.92LLDD211 pKa = 4.24LFVDD215 pKa = 3.7NALLKK220 pKa = 9.83ITDD223 pKa = 4.11NGDD226 pKa = 3.64GTWTAEE232 pKa = 4.16APDD235 pKa = 4.92SIISMLSDD243 pKa = 4.61EE244 pKa = 4.52IFQINWEE251 pKa = 4.3SAVMLDD257 pKa = 3.36EE258 pKa = 4.34DD259 pKa = 5.0TYY261 pKa = 10.86TISSFF266 pKa = 3.37
MM1 pKa = 7.49TKK3 pKa = 10.38LAWDD7 pKa = 3.56AVGEE11 pKa = 4.25RR12 pKa = 11.84FFEE15 pKa = 4.56AGADD19 pKa = 3.55RR20 pKa = 11.84GVLYY24 pKa = 10.61LDD26 pKa = 5.28DD27 pKa = 5.7VGHH30 pKa = 6.92PWNGLVAVEE39 pKa = 4.22QSPSGGEE46 pKa = 3.82PEE48 pKa = 4.84TYY50 pKa = 10.31YY51 pKa = 10.89QDD53 pKa = 3.56GLPYY57 pKa = 9.95ISVSASEE64 pKa = 4.22EE65 pKa = 4.0FKK67 pKa = 11.3GSIEE71 pKa = 4.41AYY73 pKa = 8.28TYY75 pKa = 9.79PNAFAVCDD83 pKa = 4.23GSSEE87 pKa = 4.2IAQGMYY93 pKa = 10.63LSQQDD98 pKa = 3.7RR99 pKa = 11.84KK100 pKa = 10.39PFGLSYY106 pKa = 9.84RR107 pKa = 11.84TLIGNDD113 pKa = 2.96IQEE116 pKa = 4.58LEE118 pKa = 4.32FGYY121 pKa = 10.14KK122 pKa = 8.87IHH124 pKa = 7.73IIYY127 pKa = 10.62NCMASPSSRR136 pKa = 11.84SYY138 pKa = 11.47SSLGEE143 pKa = 3.9SDD145 pKa = 3.4NAEE148 pKa = 4.04TFNWSITTRR157 pKa = 11.84PVKK160 pKa = 10.76FEE162 pKa = 4.5DD163 pKa = 3.22VTFGIKK169 pKa = 10.21YY170 pKa = 8.8GAHH173 pKa = 4.98VTLDD177 pKa = 3.4SRR179 pKa = 11.84EE180 pKa = 4.09VYY182 pKa = 8.57PWAMAAVEE190 pKa = 4.1EE191 pKa = 4.42VLYY194 pKa = 8.91GTDD197 pKa = 3.12EE198 pKa = 4.32TEE200 pKa = 4.09ARR202 pKa = 11.84LPTPQEE208 pKa = 3.92LLDD211 pKa = 4.24LFVDD215 pKa = 3.7NALLKK220 pKa = 9.83ITDD223 pKa = 4.11NGDD226 pKa = 3.64GTWTAEE232 pKa = 4.16APDD235 pKa = 4.92SIISMLSDD243 pKa = 4.61EE244 pKa = 4.52IFQINWEE251 pKa = 4.3SAVMLDD257 pKa = 3.36EE258 pKa = 4.34DD259 pKa = 5.0TYY261 pKa = 10.86TISSFF266 pKa = 3.37
Molecular weight: 29.61 kDa
Isoelectric point according different methods:
Protein with the highest isoelectric point:
>tr|A0A5J6TS94|A0A5J6TS94_9CAUD Helix-turn-helix DNA-binding protein OS=Arthrobacter phage Shepard OX=2599833 GN=91 PE=4 SV=1
MM1 pKa = 7.56GAGLKK6 pKa = 8.59PTFKK10 pKa = 10.15PACPKK15 pKa = 10.48CDD17 pKa = 3.53FTLGYY22 pKa = 9.07YY23 pKa = 10.1VRR25 pKa = 11.84DD26 pKa = 3.91PDD28 pKa = 3.66VHH30 pKa = 6.13PDD32 pKa = 2.88KK33 pKa = 10.69WVLNEE38 pKa = 4.86ASRR41 pKa = 11.84QHH43 pKa = 6.31LKK45 pKa = 9.12EE46 pKa = 3.53AHH48 pKa = 6.21VIVVPEE54 pKa = 3.85VRR56 pKa = 11.84AIHH59 pKa = 5.87PVRR62 pKa = 11.84SFRR65 pKa = 11.84SRR67 pKa = 11.84RR68 pKa = 11.84RR69 pKa = 11.84LLSSKK74 pKa = 10.28RR75 pKa = 11.84RR76 pKa = 11.84VLVV79 pKa = 3.36
MM1 pKa = 7.56GAGLKK6 pKa = 8.59PTFKK10 pKa = 10.15PACPKK15 pKa = 10.48CDD17 pKa = 3.53FTLGYY22 pKa = 9.07YY23 pKa = 10.1VRR25 pKa = 11.84DD26 pKa = 3.91PDD28 pKa = 3.66VHH30 pKa = 6.13PDD32 pKa = 2.88KK33 pKa = 10.69WVLNEE38 pKa = 4.86ASRR41 pKa = 11.84QHH43 pKa = 6.31LKK45 pKa = 9.12EE46 pKa = 3.53AHH48 pKa = 6.21VIVVPEE54 pKa = 3.85VRR56 pKa = 11.84AIHH59 pKa = 5.87PVRR62 pKa = 11.84SFRR65 pKa = 11.84SRR67 pKa = 11.84RR68 pKa = 11.84RR69 pKa = 11.84LLSSKK74 pKa = 10.28RR75 pKa = 11.84RR76 pKa = 11.84VLVV79 pKa = 3.36
Molecular weight: 9.13 kDa
Isoelectric point according different methods:
Peptides (in silico digests for buttom-up proteomics)
Below you can find in silico digests of the whole proteome with Trypsin, Chymotrypsin, Trypsin+LysC, LysN, ArgC proteases suitable for different mass spec machines.| Try ESI |
 |
|---|
| ChTry ESI |
 |
|---|
| ArgC ESI |
 |
|---|
| LysN ESI |
 |
|---|
| TryLysC ESI |
 |
|---|
| Try MALDI |
 |
|---|
| ChTry MALDI |
 |
|---|
| ArgC MALDI |
 |
|---|
| LysN MALDI |
 |
|---|
| TryLysC MALDI |
 |
|---|
| Try LTQ |
 |
|---|
| ChTry LTQ |
 |
|---|
| ArgC LTQ |
 |
|---|
| LysN LTQ |
 |
|---|
| TryLysC LTQ |
 |
|---|
| Try MSlow |
 |
|---|
| ChTry MSlow |
 |
|---|
| ArgC MSlow |
 |
|---|
| LysN MSlow |
 |
|---|
| TryLysC MSlow |
 |
|---|
| Try MShigh |
 |
|---|
| ChTry MShigh |
 |
|---|
| ArgC MShigh |
 |
|---|
| LysN MShigh |
 |
|---|
| TryLysC MShigh |
 |
|---|
General Statistics
Number of major isoforms |
Number of additional isoforms |
Number of all proteins |
Number of amino acids |
Min. Seq. Length |
Max. Seq. Length |
Avg. Seq. Length |
Avg. Mol. Weight |
|---|---|---|---|---|---|---|---|
0 |
18233 |
30 |
1529 |
198.2 |
22.07 |
Amino acid frequency
Ala |
Cys |
Asp |
Glu |
Phe |
Gly |
His |
Ile |
Lys |
Leu |
|---|---|---|---|---|---|---|---|---|---|
8.814 ± 0.519 | 0.592 ± 0.103 |
6.049 ± 0.348 | 6.554 ± 0.388 |
3.73 ± 0.205 | 7.525 ± 0.506 |
1.892 ± 0.182 | 6.017 ± 0.219 |
6.609 ± 0.418 | 7.848 ± 0.394 |
Met |
Asn |
Gln |
Pro |
Arg |
Ser |
Thr |
Val |
Trp |
Tyr |
|---|---|---|---|---|---|---|---|---|---|
2.808 ± 0.256 | 4.448 ± 0.186 |
4.201 ± 0.252 | 3.472 ± 0.163 |
5.298 ± 0.338 | 6.198 ± 0.257 |
6.368 ± 0.282 | 6.62 ± 0.2 |
1.585 ± 0.159 | 3.373 ± 0.283 |
Most of the basic statistics you can see at this page can be downloaded from this CSV file
Proteome-pI is available under Creative Commons Attribution-NoDerivs license, for more details see here
| Reference: Kozlowski LP. Proteome-pI 2.0: Proteome Isoelectric Point Database Update. Nucleic Acids Res. 2021, doi: 10.1093/nar/gkab944 | Contact: Lukasz P. Kozlowski |
