Daphnia magna
Taxonomy: cellular organisms; Eukaryota; Opisthokonta; Metazoa; Eumetazoa; Bilateria; Protostomia; Ecdysozoa; Panarthropoda; Arthropoda; Mandibulata; Pancrustacea; Crustacea; Branchiopoda; Phyllopoda; Diplostraca; Cladocera; Anomopoda; Daphniidae; Daphnia
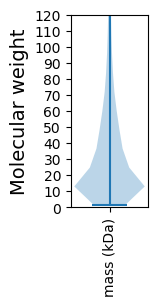
Average proteome isoelectric point is 7.05
Get precalculated fractions of proteins

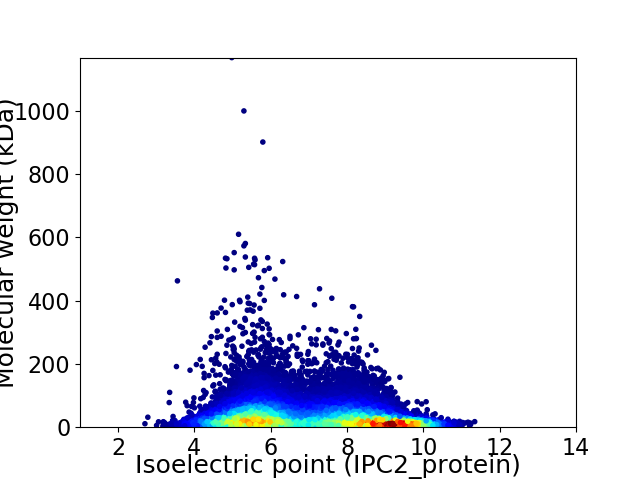
Virtual 2D-PAGE plot for 26600 proteins (isoelectric point calculated using IPC2_protein)
Get csv file with sequences according to given criteria:
* You can choose from 21 different methods for calculating isoelectric point
Summary statistics related to proteome-wise predictions


Protein with the lowest isoelectric point:
>tr|A0A164JBA2|A0A164JBA2_9CRUS Uncharacterized protein OS=Daphnia magna OX=35525 GN=APZ42_000886 PE=4 SV=1
MM1 pKa = 8.02CYY3 pKa = 10.28NKK5 pKa = 10.27EE6 pKa = 3.91EE7 pKa = 4.18QYY9 pKa = 11.75DD10 pKa = 3.81RR11 pKa = 11.84VICIGLFFLEE21 pKa = 4.58YY22 pKa = 9.84FQQHH26 pKa = 3.85QWEE29 pKa = 4.64DD30 pKa = 4.2FEE32 pKa = 6.58ASDD35 pKa = 3.95IASSVLDD42 pKa = 3.48YY43 pKa = 7.6MTNSFKK49 pKa = 10.85KK50 pKa = 10.58LRR52 pKa = 11.84DD53 pKa = 3.49RR54 pKa = 11.84PPDD57 pKa = 3.29NRR59 pKa = 11.84EE60 pKa = 3.46EE61 pKa = 4.03FTFANLMIAFEE72 pKa = 4.22FASDD76 pKa = 4.07YY77 pKa = 10.24VTGLQYY83 pKa = 10.09SEE85 pKa = 4.31RR86 pKa = 11.84RR87 pKa = 11.84SHH89 pKa = 7.51ILDD92 pKa = 3.11AHH94 pKa = 6.7EE95 pKa = 3.84SHH97 pKa = 6.14QFKK100 pKa = 10.39RR101 pKa = 11.84CLYY104 pKa = 9.57RR105 pKa = 11.84FLRR108 pKa = 11.84NDD110 pKa = 3.33RR111 pKa = 11.84RR112 pKa = 11.84WGLDD116 pKa = 3.13CQNFLHH122 pKa = 6.43MICRR126 pKa = 11.84CEE128 pKa = 5.6DD129 pKa = 3.46PLQYY133 pKa = 10.8LSRR136 pKa = 11.84PPNCAYY142 pKa = 10.12EE143 pKa = 4.24SDD145 pKa = 4.17EE146 pKa = 5.73DD147 pKa = 5.3DD148 pKa = 6.21SEE150 pKa = 6.85DD151 pKa = 5.9DD152 pKa = 6.29DD153 pKa = 6.79DD154 pKa = 7.3DD155 pKa = 6.24SDD157 pKa = 4.54NDD159 pKa = 4.96DD160 pKa = 4.58YY161 pKa = 12.13SDD163 pKa = 6.06DD164 pKa = 5.9DD165 pKa = 5.8DD166 pKa = 7.42DD167 pKa = 7.2SDD169 pKa = 6.45DD170 pKa = 6.0DD171 pKa = 5.75DD172 pKa = 7.03DD173 pKa = 6.62SDD175 pKa = 4.23SCSCVSDD182 pKa = 4.79DD183 pKa = 4.8GEE185 pKa = 4.56TDD187 pKa = 3.6GSVSGCSSCGYY198 pKa = 10.05HH199 pKa = 6.66VDD201 pKa = 4.03NGGPNDD207 pKa = 3.84NDD209 pKa = 3.89DD210 pKa = 4.48DD211 pKa = 5.17FDD213 pKa = 4.0VVRR216 pKa = 11.84FEE218 pKa = 5.91DD219 pKa = 4.04DD220 pKa = 2.92
MM1 pKa = 8.02CYY3 pKa = 10.28NKK5 pKa = 10.27EE6 pKa = 3.91EE7 pKa = 4.18QYY9 pKa = 11.75DD10 pKa = 3.81RR11 pKa = 11.84VICIGLFFLEE21 pKa = 4.58YY22 pKa = 9.84FQQHH26 pKa = 3.85QWEE29 pKa = 4.64DD30 pKa = 4.2FEE32 pKa = 6.58ASDD35 pKa = 3.95IASSVLDD42 pKa = 3.48YY43 pKa = 7.6MTNSFKK49 pKa = 10.85KK50 pKa = 10.58LRR52 pKa = 11.84DD53 pKa = 3.49RR54 pKa = 11.84PPDD57 pKa = 3.29NRR59 pKa = 11.84EE60 pKa = 3.46EE61 pKa = 4.03FTFANLMIAFEE72 pKa = 4.22FASDD76 pKa = 4.07YY77 pKa = 10.24VTGLQYY83 pKa = 10.09SEE85 pKa = 4.31RR86 pKa = 11.84RR87 pKa = 11.84SHH89 pKa = 7.51ILDD92 pKa = 3.11AHH94 pKa = 6.7EE95 pKa = 3.84SHH97 pKa = 6.14QFKK100 pKa = 10.39RR101 pKa = 11.84CLYY104 pKa = 9.57RR105 pKa = 11.84FLRR108 pKa = 11.84NDD110 pKa = 3.33RR111 pKa = 11.84RR112 pKa = 11.84WGLDD116 pKa = 3.13CQNFLHH122 pKa = 6.43MICRR126 pKa = 11.84CEE128 pKa = 5.6DD129 pKa = 3.46PLQYY133 pKa = 10.8LSRR136 pKa = 11.84PPNCAYY142 pKa = 10.12EE143 pKa = 4.24SDD145 pKa = 4.17EE146 pKa = 5.73DD147 pKa = 5.3DD148 pKa = 6.21SEE150 pKa = 6.85DD151 pKa = 5.9DD152 pKa = 6.29DD153 pKa = 6.79DD154 pKa = 7.3DD155 pKa = 6.24SDD157 pKa = 4.54NDD159 pKa = 4.96DD160 pKa = 4.58YY161 pKa = 12.13SDD163 pKa = 6.06DD164 pKa = 5.9DD165 pKa = 5.8DD166 pKa = 7.42DD167 pKa = 7.2SDD169 pKa = 6.45DD170 pKa = 6.0DD171 pKa = 5.75DD172 pKa = 7.03DD173 pKa = 6.62SDD175 pKa = 4.23SCSCVSDD182 pKa = 4.79DD183 pKa = 4.8GEE185 pKa = 4.56TDD187 pKa = 3.6GSVSGCSSCGYY198 pKa = 10.05HH199 pKa = 6.66VDD201 pKa = 4.03NGGPNDD207 pKa = 3.84NDD209 pKa = 3.89DD210 pKa = 4.48DD211 pKa = 5.17FDD213 pKa = 4.0VVRR216 pKa = 11.84FEE218 pKa = 5.91DD219 pKa = 4.04DD220 pKa = 2.92
Molecular weight: 25.69 kDa
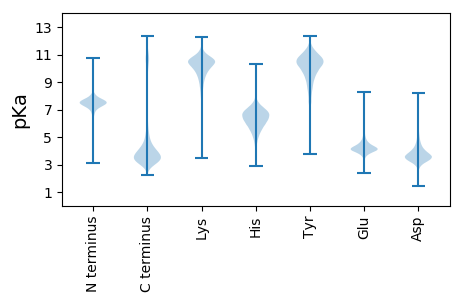
Isoelectric point according different methods:
Protein with the highest isoelectric point:
>tr|A0A164JX05|A0A164JX05_9CRUS Peptidase_M1 domain-containing protein (Fragment) OS=Daphnia magna OX=35525 GN=APZ42_000101 PE=4 SV=1
PP1 pKa = 7.9LLITRR6 pKa = 11.84QLTLLQATTLRR17 pKa = 11.84LPNTTQQRR25 pKa = 11.84HH26 pKa = 4.94RR27 pKa = 11.84STTQRR32 pKa = 11.84LTLPQVTTPQLVLRR46 pKa = 11.84TTWNLATTPQLMLLRR61 pKa = 11.84LTMLRR66 pKa = 11.84LLNTTPPRR74 pKa = 11.84LPSTQRR80 pKa = 11.84MLRR83 pKa = 11.84QVTIPKK89 pKa = 9.76PPSTTLLPMLLQFTTLKK106 pKa = 10.78LPNTTPLRR114 pKa = 11.84PLNTTLLQPRR124 pKa = 11.84SITPRR129 pKa = 11.84KK130 pKa = 9.96LSTSPHH136 pKa = 5.62LTQLQPTTLL145 pKa = 3.58
PP1 pKa = 7.9LLITRR6 pKa = 11.84QLTLLQATTLRR17 pKa = 11.84LPNTTQQRR25 pKa = 11.84HH26 pKa = 4.94RR27 pKa = 11.84STTQRR32 pKa = 11.84LTLPQVTTPQLVLRR46 pKa = 11.84TTWNLATTPQLMLLRR61 pKa = 11.84LTMLRR66 pKa = 11.84LLNTTPPRR74 pKa = 11.84LPSTQRR80 pKa = 11.84MLRR83 pKa = 11.84QVTIPKK89 pKa = 9.76PPSTTLLPMLLQFTTLKK106 pKa = 10.78LPNTTPLRR114 pKa = 11.84PLNTTLLQPRR124 pKa = 11.84SITPRR129 pKa = 11.84KK130 pKa = 9.96LSTSPHH136 pKa = 5.62LTQLQPTTLL145 pKa = 3.58
Molecular weight: 16.53 kDa
Isoelectric point according different methods:
Peptides (in silico digests for buttom-up proteomics)
Below you can find in silico digests of the whole proteome with Trypsin, Chymotrypsin, Trypsin+LysC, LysN, ArgC proteases suitable for different mass spec machines.| Try ESI |
 |
|---|
| ChTry ESI |
 |
|---|
| ArgC ESI |
 |
|---|
| LysN ESI |
 |
|---|
| TryLysC ESI |
 |
|---|
| Try MALDI |
 |
|---|
| ChTry MALDI |
 |
|---|
| ArgC MALDI |
 |
|---|
| LysN MALDI |
 |
|---|
| TryLysC MALDI |
 |
|---|
| Try LTQ |
 |
|---|
| ChTry LTQ |
 |
|---|
| ArgC LTQ |
 |
|---|
| LysN LTQ |
 |
|---|
| TryLysC LTQ |
 |
|---|
| Try MSlow |
 |
|---|
| ChTry MSlow |
 |
|---|
| ArgC MSlow |
 |
|---|
| LysN MSlow |
 |
|---|
| TryLysC MSlow |
 |
|---|
| Try MShigh |
 |
|---|
| ChTry MShigh |
 |
|---|
| ArgC MShigh |
 |
|---|
| LysN MShigh |
 |
|---|
| TryLysC MShigh |
 |
|---|
General Statistics
Number of major isoforms |
Number of additional isoforms |
Number of all proteins |
Number of amino acids |
Min. Seq. Length |
Max. Seq. Length |
Avg. Seq. Length |
Avg. Mol. Weight |
|---|---|---|---|---|---|---|---|
9136891 |
9 |
10574 |
343.5 |
38.39 |
Amino acid frequency
Ala |
Cys |
Asp |
Glu |
Phe |
Gly |
His |
Ile |
Lys |
Leu |
|---|---|---|---|---|---|---|---|---|---|
6.854 ± 0.016 | 1.98 ± 0.017 |
5.13 ± 0.012 | 6.171 ± 0.023 |
4.005 ± 0.013 | 5.733 ± 0.022 |
2.578 ± 0.009 | 5.236 ± 0.013 |
5.623 ± 0.023 | 9.236 ± 0.022 |
Met |
Asn |
Gln |
Pro |
Arg |
Ser |
Thr |
Val |
Trp |
Tyr |
|---|---|---|---|---|---|---|---|---|---|
2.246 ± 0.009 | 4.57 ± 0.012 |
5.45 ± 0.024 | 4.432 ± 0.018 |
5.674 ± 0.013 | 8.633 ± 0.02 |
5.906 ± 0.019 | 6.361 ± 0.014 |
1.215 ± 0.006 | 2.813 ± 0.01 |
Most of the basic statistics you can see at this page can be downloaded from this CSV file
Proteome-pI is available under Creative Commons Attribution-NoDerivs license, for more details see here
| Reference: Kozlowski LP. Proteome-pI 2.0: Proteome Isoelectric Point Database Update. Nucleic Acids Res. 2021, doi: 10.1093/nar/gkab944 | Contact: Lukasz P. Kozlowski |
