Capybara microvirus Cap3_SP_632
Taxonomy: Viruses; Monodnaviria; Sangervirae; Phixviricota; Malgrandaviricetes; Petitvirales; Microviridae; unclassified Microviridae
Average proteome isoelectric point is 6.11
Get precalculated fractions of proteins

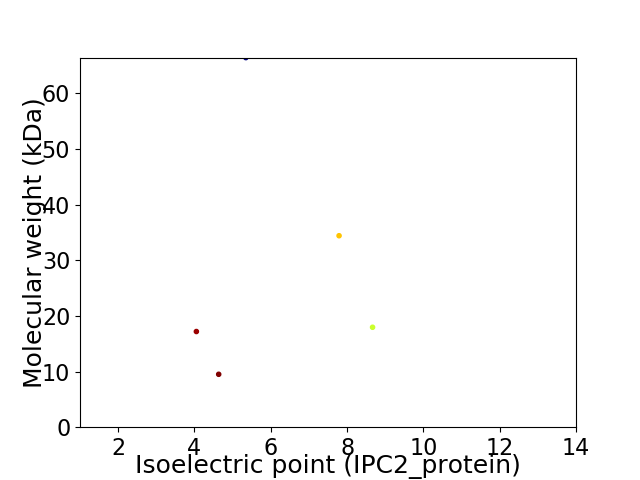
Virtual 2D-PAGE plot for 5 proteins (isoelectric point calculated using IPC2_protein)
Get csv file with sequences according to given criteria:
* You can choose from 21 different methods for calculating isoelectric point
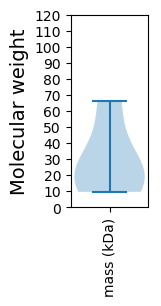
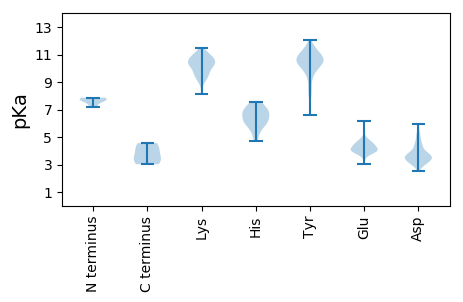
Summary statistics related to proteome-wise predictions


Protein with the lowest isoelectric point:
>tr|A0A4V1FVV2|A0A4V1FVV2_9VIRU Minor capsid protein OS=Capybara microvirus Cap3_SP_632 OX=2585484 PE=4 SV=1
MM1 pKa = 7.74KK2 pKa = 10.1FQSKK6 pKa = 9.14FNRR9 pKa = 11.84FAKK12 pKa = 10.18VFSKK16 pKa = 10.73AGEE19 pKa = 3.96PTVTVNILNIDD30 pKa = 3.56GSLAEE35 pKa = 4.82SYY37 pKa = 10.75IDD39 pKa = 5.73DD40 pKa = 4.95LDD42 pKa = 5.2ALIQSNADD50 pKa = 3.37SGDD53 pKa = 3.29VSKK56 pKa = 11.12LIEE59 pKa = 4.51RR60 pKa = 11.84FTLTGDD66 pKa = 3.4DD67 pKa = 3.7SVFNVSNGFYY77 pKa = 10.68GDD79 pKa = 3.52VSGLEE84 pKa = 3.87NLTIHH89 pKa = 7.57DD90 pKa = 3.85YY91 pKa = 9.68SQRR94 pKa = 11.84TSAAIDD100 pKa = 4.26FYY102 pKa = 11.81DD103 pKa = 4.89SLPKK107 pKa = 10.23NIKK110 pKa = 9.54EE111 pKa = 4.3MYY113 pKa = 8.85PSPEE117 pKa = 4.07EE118 pKa = 3.84FFKK121 pKa = 11.35SIDD124 pKa = 3.68DD125 pKa = 4.18PKK127 pKa = 11.03LSEE130 pKa = 4.52AFDD133 pKa = 3.83NFLSISNTKK142 pKa = 9.85TSDD145 pKa = 3.29SDD147 pKa = 5.42DD148 pKa = 3.59EE149 pKa = 6.16GGDD152 pKa = 3.69NNASS156 pKa = 3.25
MM1 pKa = 7.74KK2 pKa = 10.1FQSKK6 pKa = 9.14FNRR9 pKa = 11.84FAKK12 pKa = 10.18VFSKK16 pKa = 10.73AGEE19 pKa = 3.96PTVTVNILNIDD30 pKa = 3.56GSLAEE35 pKa = 4.82SYY37 pKa = 10.75IDD39 pKa = 5.73DD40 pKa = 4.95LDD42 pKa = 5.2ALIQSNADD50 pKa = 3.37SGDD53 pKa = 3.29VSKK56 pKa = 11.12LIEE59 pKa = 4.51RR60 pKa = 11.84FTLTGDD66 pKa = 3.4DD67 pKa = 3.7SVFNVSNGFYY77 pKa = 10.68GDD79 pKa = 3.52VSGLEE84 pKa = 3.87NLTIHH89 pKa = 7.57DD90 pKa = 3.85YY91 pKa = 9.68SQRR94 pKa = 11.84TSAAIDD100 pKa = 4.26FYY102 pKa = 11.81DD103 pKa = 4.89SLPKK107 pKa = 10.23NIKK110 pKa = 9.54EE111 pKa = 4.3MYY113 pKa = 8.85PSPEE117 pKa = 4.07EE118 pKa = 3.84FFKK121 pKa = 11.35SIDD124 pKa = 3.68DD125 pKa = 4.18PKK127 pKa = 11.03LSEE130 pKa = 4.52AFDD133 pKa = 3.83NFLSISNTKK142 pKa = 9.85TSDD145 pKa = 3.29SDD147 pKa = 5.42DD148 pKa = 3.59EE149 pKa = 6.16GGDD152 pKa = 3.69NNASS156 pKa = 3.25
Molecular weight: 17.2 kDa
Isoelectric point according different methods:
Protein with the highest isoelectric point:
>tr|A0A4P8W694|A0A4P8W694_9VIRU Replication initiator protein OS=Capybara microvirus Cap3_SP_632 OX=2585484 PE=4 SV=1
MM1 pKa = 7.79ADD3 pKa = 3.27SYY5 pKa = 12.08YY6 pKa = 11.32NDD8 pKa = 3.55ALKK11 pKa = 10.73LLKK14 pKa = 10.1QEE16 pKa = 4.23QKK18 pKa = 10.6FSRR21 pKa = 11.84EE22 pKa = 3.89TQQLQTNLSNTAHH35 pKa = 5.33QRR37 pKa = 11.84EE38 pKa = 4.54VKK40 pKa = 10.63DD41 pKa = 3.74LVAAGLNPVLSSGGSGASFSISEE64 pKa = 4.38GNSGVASATQYY75 pKa = 10.25MSAKK79 pKa = 9.71IAQEE83 pKa = 3.92TQLAQIAMQKK93 pKa = 10.32EE94 pKa = 3.97IAQIQANAQIKK105 pKa = 9.13AANTSAAATKK115 pKa = 10.17YY116 pKa = 10.55AADD119 pKa = 4.01KK120 pKa = 10.86NYY122 pKa = 10.46EE123 pKa = 4.26SNQYY127 pKa = 8.34TVDD130 pKa = 3.39YY131 pKa = 10.42SRR133 pKa = 11.84NGSVAGTVGSAAKK146 pKa = 10.01QIWNSIKK153 pKa = 10.78KK154 pKa = 9.35FMPKK158 pKa = 10.23DD159 pKa = 3.51NSKK162 pKa = 8.51TFHH165 pKa = 5.86WW166 pKa = 4.56
MM1 pKa = 7.79ADD3 pKa = 3.27SYY5 pKa = 12.08YY6 pKa = 11.32NDD8 pKa = 3.55ALKK11 pKa = 10.73LLKK14 pKa = 10.1QEE16 pKa = 4.23QKK18 pKa = 10.6FSRR21 pKa = 11.84EE22 pKa = 3.89TQQLQTNLSNTAHH35 pKa = 5.33QRR37 pKa = 11.84EE38 pKa = 4.54VKK40 pKa = 10.63DD41 pKa = 3.74LVAAGLNPVLSSGGSGASFSISEE64 pKa = 4.38GNSGVASATQYY75 pKa = 10.25MSAKK79 pKa = 9.71IAQEE83 pKa = 3.92TQLAQIAMQKK93 pKa = 10.32EE94 pKa = 3.97IAQIQANAQIKK105 pKa = 9.13AANTSAAATKK115 pKa = 10.17YY116 pKa = 10.55AADD119 pKa = 4.01KK120 pKa = 10.86NYY122 pKa = 10.46EE123 pKa = 4.26SNQYY127 pKa = 8.34TVDD130 pKa = 3.39YY131 pKa = 10.42SRR133 pKa = 11.84NGSVAGTVGSAAKK146 pKa = 10.01QIWNSIKK153 pKa = 10.78KK154 pKa = 9.35FMPKK158 pKa = 10.23DD159 pKa = 3.51NSKK162 pKa = 8.51TFHH165 pKa = 5.86WW166 pKa = 4.56
Molecular weight: 17.96 kDa
Isoelectric point according different methods:
Peptides (in silico digests for buttom-up proteomics)
Below you can find in silico digests of the whole proteome with Trypsin, Chymotrypsin, Trypsin+LysC, LysN, ArgC proteases suitable for different mass spec machines.| Try ESI |
 |
|---|
| ChTry ESI |
 |
|---|
| ArgC ESI |
 |
|---|
| LysN ESI |
 |
|---|
| TryLysC ESI |
 |
|---|
| Try MALDI |
 |
|---|
| ChTry MALDI |
 |
|---|
| ArgC MALDI |
 |
|---|
| LysN MALDI |
 |
|---|
| TryLysC MALDI |
 |
|---|
| Try LTQ |
 |
|---|
| ChTry LTQ |
 |
|---|
| ArgC LTQ |
 |
|---|
| LysN LTQ |
 |
|---|
| TryLysC LTQ |
 |
|---|
| Try MSlow |
 |
|---|
| ChTry MSlow |
 |
|---|
| ArgC MSlow |
 |
|---|
| LysN MSlow |
 |
|---|
| TryLysC MSlow |
 |
|---|
| Try MShigh |
 |
|---|
| ChTry MShigh |
 |
|---|
| ArgC MShigh |
 |
|---|
| LysN MShigh |
 |
|---|
| TryLysC MShigh |
 |
|---|
General Statistics
Number of major isoforms |
Number of additional isoforms |
Number of all proteins |
Number of amino acids |
Min. Seq. Length |
Max. Seq. Length |
Avg. Seq. Length |
Avg. Mol. Weight |
|---|---|---|---|---|---|---|---|
0 |
1285 |
87 |
578 |
257.0 |
29.11 |
Amino acid frequency
Ala |
Cys |
Asp |
Glu |
Phe |
Gly |
His |
Ile |
Lys |
Leu |
|---|---|---|---|---|---|---|---|---|---|
5.914 ± 1.631 | 1.634 ± 0.841 |
7.16 ± 1.03 | 4.514 ± 0.324 |
6.693 ± 0.806 | 6.537 ± 0.307 |
1.946 ± 0.527 | 5.681 ± 0.622 |
5.914 ± 1.196 | 7.004 ± 0.318 |
Met |
Asn |
Gln |
Pro |
Arg |
Ser |
Thr |
Val |
Trp |
Tyr |
|---|---|---|---|---|---|---|---|---|---|
1.556 ± 0.2 | 6.693 ± 0.316 |
4.202 ± 0.868 | 3.424 ± 1.083 |
4.047 ± 0.726 | 9.416 ± 0.965 |
4.903 ± 0.533 | 5.681 ± 0.382 |
1.012 ± 0.248 | 6.07 ± 0.79 |
Most of the basic statistics you can see at this page can be downloaded from this CSV file
Proteome-pI is available under Creative Commons Attribution-NoDerivs license, for more details see here
| Reference: Kozlowski LP. Proteome-pI 2.0: Proteome Isoelectric Point Database Update. Nucleic Acids Res. 2021, doi: 10.1093/nar/gkab944 | Contact: Lukasz P. Kozlowski |
