Rhodoplanes elegans
Taxonomy: cellular organisms; Bacteria; Proteobacteria; Alphaproteobacteria; Hyphomicrobiales; Hyphomicrobiaceae; Rhodoplanes
Average proteome isoelectric point is 6.95
Get precalculated fractions of proteins

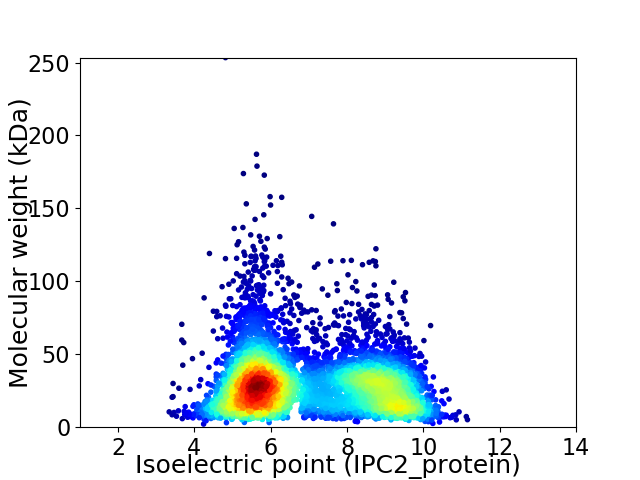
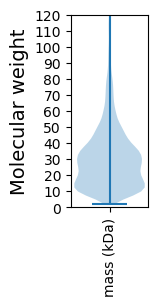
Virtual 2D-PAGE plot for 5973 proteins (isoelectric point calculated using IPC2_protein)
Get csv file with sequences according to given criteria:
* You can choose from 21 different methods for calculating isoelectric point
Summary statistics related to proteome-wise predictions


Protein with the lowest isoelectric point:
>tr|A0A327KY74|A0A327KY74_9RHIZ Xanthine dehydrogenase OS=Rhodoplanes elegans OX=29408 GN=CH338_00985 PE=4 SV=1
MM1 pKa = 7.29SLSGALNSAVSALNSQSQAISMVSDD26 pKa = 4.35NIANASTTGYY36 pKa = 8.56KK37 pKa = 9.3TVTASFEE44 pKa = 4.45SLLSSSSSSAGYY56 pKa = 10.54ASGGVAVSARR66 pKa = 11.84YY67 pKa = 9.43NISEE71 pKa = 4.1QGLLTSSTSDD81 pKa = 2.54TAMAIDD87 pKa = 3.91GNGFFVVRR95 pKa = 11.84DD96 pKa = 3.84ASGSTYY102 pKa = 7.56YY103 pKa = 9.98TRR105 pKa = 11.84NGDD108 pKa = 4.53AVIDD112 pKa = 4.13DD113 pKa = 4.18ANGYY117 pKa = 7.89LTIGGNYY124 pKa = 9.49LMGWPTDD131 pKa = 3.16QDD133 pKa = 3.91GNVTGGEE140 pKa = 4.04TAATLTRR147 pKa = 11.84IDD149 pKa = 3.5TSALQSVASATTTEE163 pKa = 4.33IIEE166 pKa = 4.47ANLPADD172 pKa = 3.8AATNATFTTTMDD184 pKa = 3.44VYY186 pKa = 11.34DD187 pKa = 4.05SLGTASSVTITWEE200 pKa = 3.87KK201 pKa = 9.35TGEE204 pKa = 4.19NNWTASFSNATLSSDD219 pKa = 3.43SSVTSGTVTGSIDD232 pKa = 3.26IVFNEE237 pKa = 4.69DD238 pKa = 2.58GTLASTSPSPATISITGWTTGAANQTITLDD268 pKa = 3.41LGTVGGADD276 pKa = 3.69GLTQYY281 pKa = 11.18SSDD284 pKa = 3.7SQTPSIDD291 pKa = 3.86LKK293 pKa = 11.44SIDD296 pKa = 4.24QDD298 pKa = 3.43GLAYY302 pKa = 10.42GSLTGISVEE311 pKa = 4.4DD312 pKa = 4.01GGNVTATYY320 pKa = 10.97SNGEE324 pKa = 4.0TYY326 pKa = 10.54VIYY329 pKa = 10.36KK330 pKa = 9.75VAVATFANADD340 pKa = 3.58GLTTVSGGMYY350 pKa = 9.92QEE352 pKa = 4.37STKK355 pKa = 10.88SGSATLHH362 pKa = 5.42EE363 pKa = 5.5AGLGGAGSIKK373 pKa = 10.25GSKK376 pKa = 10.09LEE378 pKa = 4.21SSTADD383 pKa = 3.19TTAEE387 pKa = 4.03FSTMITAQQAYY398 pKa = 9.09SAAAQVVSTVSEE410 pKa = 4.31MYY412 pKa = 8.28DD413 pKa = 3.0TLMSSVRR420 pKa = 3.49
MM1 pKa = 7.29SLSGALNSAVSALNSQSQAISMVSDD26 pKa = 4.35NIANASTTGYY36 pKa = 8.56KK37 pKa = 9.3TVTASFEE44 pKa = 4.45SLLSSSSSSAGYY56 pKa = 10.54ASGGVAVSARR66 pKa = 11.84YY67 pKa = 9.43NISEE71 pKa = 4.1QGLLTSSTSDD81 pKa = 2.54TAMAIDD87 pKa = 3.91GNGFFVVRR95 pKa = 11.84DD96 pKa = 3.84ASGSTYY102 pKa = 7.56YY103 pKa = 9.98TRR105 pKa = 11.84NGDD108 pKa = 4.53AVIDD112 pKa = 4.13DD113 pKa = 4.18ANGYY117 pKa = 7.89LTIGGNYY124 pKa = 9.49LMGWPTDD131 pKa = 3.16QDD133 pKa = 3.91GNVTGGEE140 pKa = 4.04TAATLTRR147 pKa = 11.84IDD149 pKa = 3.5TSALQSVASATTTEE163 pKa = 4.33IIEE166 pKa = 4.47ANLPADD172 pKa = 3.8AATNATFTTTMDD184 pKa = 3.44VYY186 pKa = 11.34DD187 pKa = 4.05SLGTASSVTITWEE200 pKa = 3.87KK201 pKa = 9.35TGEE204 pKa = 4.19NNWTASFSNATLSSDD219 pKa = 3.43SSVTSGTVTGSIDD232 pKa = 3.26IVFNEE237 pKa = 4.69DD238 pKa = 2.58GTLASTSPSPATISITGWTTGAANQTITLDD268 pKa = 3.41LGTVGGADD276 pKa = 3.69GLTQYY281 pKa = 11.18SSDD284 pKa = 3.7SQTPSIDD291 pKa = 3.86LKK293 pKa = 11.44SIDD296 pKa = 4.24QDD298 pKa = 3.43GLAYY302 pKa = 10.42GSLTGISVEE311 pKa = 4.4DD312 pKa = 4.01GGNVTATYY320 pKa = 10.97SNGEE324 pKa = 4.0TYY326 pKa = 10.54VIYY329 pKa = 10.36KK330 pKa = 9.75VAVATFANADD340 pKa = 3.58GLTTVSGGMYY350 pKa = 9.92QEE352 pKa = 4.37STKK355 pKa = 10.88SGSATLHH362 pKa = 5.42EE363 pKa = 5.5AGLGGAGSIKK373 pKa = 10.25GSKK376 pKa = 10.09LEE378 pKa = 4.21SSTADD383 pKa = 3.19TTAEE387 pKa = 4.03FSTMITAQQAYY398 pKa = 9.09SAAAQVVSTVSEE410 pKa = 4.31MYY412 pKa = 8.28DD413 pKa = 3.0TLMSSVRR420 pKa = 3.49
Molecular weight: 42.54 kDa
Isoelectric point according different methods:
Protein with the highest isoelectric point:
>tr|A0A327KJX9|A0A327KJX9_9RHIZ Uncharacterized protein OS=Rhodoplanes elegans OX=29408 GN=CH338_14630 PE=4 SV=1
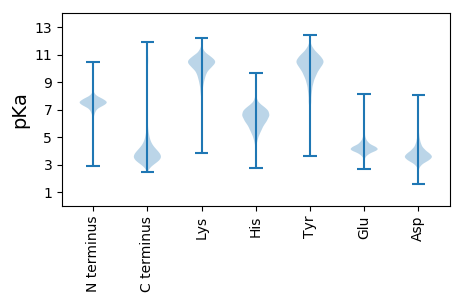
MM1 pKa = 7.63ARR3 pKa = 11.84PIGAVAVRR11 pKa = 11.84AAALTPARR19 pKa = 11.84LPVALATVAPPIVALLATLRR39 pKa = 11.84TVAPIAAMVATAAAIGPIAARR60 pKa = 11.84FGALRR65 pKa = 11.84RR66 pKa = 11.84RR67 pKa = 11.84HH68 pKa = 5.08GLAVRR73 pKa = 4.34
MM1 pKa = 7.63ARR3 pKa = 11.84PIGAVAVRR11 pKa = 11.84AAALTPARR19 pKa = 11.84LPVALATVAPPIVALLATLRR39 pKa = 11.84TVAPIAAMVATAAAIGPIAARR60 pKa = 11.84FGALRR65 pKa = 11.84RR66 pKa = 11.84RR67 pKa = 11.84HH68 pKa = 5.08GLAVRR73 pKa = 4.34
Molecular weight: 7.28 kDa
Isoelectric point according different methods:
Peptides (in silico digests for buttom-up proteomics)
Below you can find in silico digests of the whole proteome with Trypsin, Chymotrypsin, Trypsin+LysC, LysN, ArgC proteases suitable for different mass spec machines.| Try ESI |
 |
|---|
| ChTry ESI |
 |
|---|
| ArgC ESI |
 |
|---|
| LysN ESI |
 |
|---|
| TryLysC ESI |
 |
|---|
| Try MALDI |
 |
|---|
| ChTry MALDI |
 |
|---|
| ArgC MALDI |
 |
|---|
| LysN MALDI |
 |
|---|
| TryLysC MALDI |
 |
|---|
| Try LTQ |
 |
|---|
| ChTry LTQ |
 |
|---|
| ArgC LTQ |
 |
|---|
| LysN LTQ |
 |
|---|
| TryLysC LTQ |
 |
|---|
| Try MSlow |
 |
|---|
| ChTry MSlow |
 |
|---|
| ArgC MSlow |
 |
|---|
| LysN MSlow |
 |
|---|
| TryLysC MSlow |
 |
|---|
| Try MShigh |
 |
|---|
| ChTry MShigh |
 |
|---|
| ArgC MShigh |
 |
|---|
| LysN MShigh |
 |
|---|
| TryLysC MShigh |
 |
|---|
General Statistics
Number of major isoforms |
Number of additional isoforms |
Number of all proteins |
Number of amino acids |
Min. Seq. Length |
Max. Seq. Length |
Avg. Seq. Length |
Avg. Mol. Weight |
|---|---|---|---|---|---|---|---|
0 |
1759521 |
19 |
2359 |
294.6 |
31.67 |
Amino acid frequency
Ala |
Cys |
Asp |
Glu |
Phe |
Gly |
His |
Ile |
Lys |
Leu |
|---|---|---|---|---|---|---|---|---|---|
13.919 ± 0.053 | 0.83 ± 0.011 |
5.678 ± 0.025 | 5.253 ± 0.024 |
3.444 ± 0.02 | 8.744 ± 0.034 |
1.953 ± 0.017 | 4.673 ± 0.023 |
2.978 ± 0.027 | 9.963 ± 0.039 |
Met |
Asn |
Gln |
Pro |
Arg |
Ser |
Thr |
Val |
Trp |
Tyr |
|---|---|---|---|---|---|---|---|---|---|
2.222 ± 0.016 | 2.076 ± 0.017 |
5.745 ± 0.027 | 2.701 ± 0.018 |
7.793 ± 0.034 | 4.789 ± 0.025 |
5.657 ± 0.027 | 8.303 ± 0.03 |
1.308 ± 0.013 | 1.971 ± 0.014 |
Most of the basic statistics you can see at this page can be downloaded from this CSV file
Proteome-pI is available under Creative Commons Attribution-NoDerivs license, for more details see here
| Reference: Kozlowski LP. Proteome-pI 2.0: Proteome Isoelectric Point Database Update. Nucleic Acids Res. 2021, doi: 10.1093/nar/gkab944 | Contact: Lukasz P. Kozlowski |
