Soybean cyst nematode socyvirus
Taxonomy: Viruses; Riboviria; Orthornavirae; Negarnaviricota; Haploviricotina; Monjiviricetes; Mononegavirales; Nyamiviridae; Socyvirus
Average proteome isoelectric point is 6.58
Get precalculated fractions of proteins

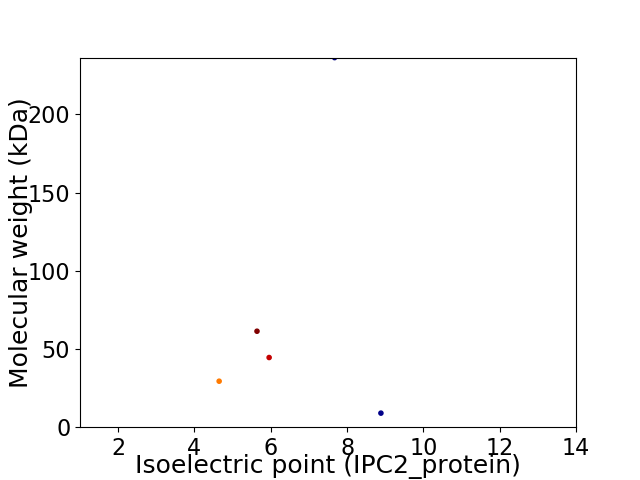
Virtual 2D-PAGE plot for 5 proteins (isoelectric point calculated using IPC2_protein)
Get csv file with sequences according to given criteria:
* You can choose from 21 different methods for calculating isoelectric point
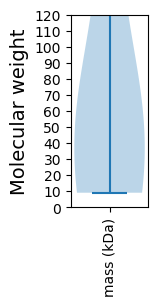
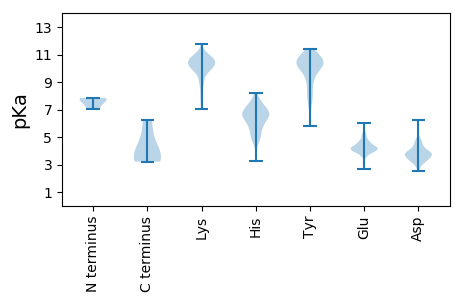
Summary statistics related to proteome-wise predictions


Protein with the lowest isoelectric point:
>tr|G0WXQ0|G0WXQ0_9MONO Uncharacterized protein OS=Soybean cyst nematode socyvirus OX=1034377 PE=4 SV=1
MM1 pKa = 7.38SASQRR6 pKa = 11.84GSTSQPSGSNGQPTPSPDD24 pKa = 3.29RR25 pKa = 11.84HH26 pKa = 5.59WSSTPSLLNVLQSAVDD42 pKa = 3.72RR43 pKa = 11.84AATFQTTARR52 pKa = 11.84PPPNPNSLAPPPVVVEE68 pKa = 4.7GGSDD72 pKa = 3.45MEE74 pKa = 4.81PDD76 pKa = 3.43EE77 pKa = 5.63EE78 pKa = 5.29EE79 pKa = 4.3DD80 pKa = 4.18TEE82 pKa = 4.34HH83 pKa = 6.65QNKK86 pKa = 9.31GPNDD90 pKa = 3.84DD91 pKa = 4.41EE92 pKa = 4.75VADD95 pKa = 4.03SQEE98 pKa = 4.21SGGNSDD104 pKa = 5.34DD105 pKa = 4.63HH106 pKa = 7.59PDD108 pKa = 3.84DD109 pKa = 5.97AGDD112 pKa = 3.74TNSAGLLTQLAAALAVPGTEE132 pKa = 3.96HH133 pKa = 7.18FMGTLAQDD141 pKa = 3.45LHH143 pKa = 6.41GLPSRR148 pKa = 11.84EE149 pKa = 3.95KK150 pKa = 10.8DD151 pKa = 3.29RR152 pKa = 11.84LFAALLINIAYY163 pKa = 9.11RR164 pKa = 11.84QANPPPPPPAPSAIDD179 pKa = 3.53PDD181 pKa = 3.65LAARR185 pKa = 11.84LNAMNIRR192 pKa = 11.84IHH194 pKa = 5.06QLQVKK199 pKa = 9.85VGFDD203 pKa = 3.44TTDD206 pKa = 3.37PLANPPIPPVASYY219 pKa = 11.34GGGLPFGSGPSNPDD233 pKa = 2.52MTTAFAGYY241 pKa = 10.16GRR243 pKa = 11.84GSTTMSTAPKK253 pKa = 10.05VPQTPEE259 pKa = 3.45QTPEE263 pKa = 3.66EE264 pKa = 4.34KK265 pKa = 10.41AKK267 pKa = 10.68KK268 pKa = 9.96VADD271 pKa = 3.96KK272 pKa = 10.27LAKK275 pKa = 9.49MKK277 pKa = 10.45NQNLL281 pKa = 3.62
MM1 pKa = 7.38SASQRR6 pKa = 11.84GSTSQPSGSNGQPTPSPDD24 pKa = 3.29RR25 pKa = 11.84HH26 pKa = 5.59WSSTPSLLNVLQSAVDD42 pKa = 3.72RR43 pKa = 11.84AATFQTTARR52 pKa = 11.84PPPNPNSLAPPPVVVEE68 pKa = 4.7GGSDD72 pKa = 3.45MEE74 pKa = 4.81PDD76 pKa = 3.43EE77 pKa = 5.63EE78 pKa = 5.29EE79 pKa = 4.3DD80 pKa = 4.18TEE82 pKa = 4.34HH83 pKa = 6.65QNKK86 pKa = 9.31GPNDD90 pKa = 3.84DD91 pKa = 4.41EE92 pKa = 4.75VADD95 pKa = 4.03SQEE98 pKa = 4.21SGGNSDD104 pKa = 5.34DD105 pKa = 4.63HH106 pKa = 7.59PDD108 pKa = 3.84DD109 pKa = 5.97AGDD112 pKa = 3.74TNSAGLLTQLAAALAVPGTEE132 pKa = 3.96HH133 pKa = 7.18FMGTLAQDD141 pKa = 3.45LHH143 pKa = 6.41GLPSRR148 pKa = 11.84EE149 pKa = 3.95KK150 pKa = 10.8DD151 pKa = 3.29RR152 pKa = 11.84LFAALLINIAYY163 pKa = 9.11RR164 pKa = 11.84QANPPPPPPAPSAIDD179 pKa = 3.53PDD181 pKa = 3.65LAARR185 pKa = 11.84LNAMNIRR192 pKa = 11.84IHH194 pKa = 5.06QLQVKK199 pKa = 9.85VGFDD203 pKa = 3.44TTDD206 pKa = 3.37PLANPPIPPVASYY219 pKa = 11.34GGGLPFGSGPSNPDD233 pKa = 2.52MTTAFAGYY241 pKa = 10.16GRR243 pKa = 11.84GSTTMSTAPKK253 pKa = 10.05VPQTPEE259 pKa = 3.45QTPEE263 pKa = 3.66EE264 pKa = 4.34KK265 pKa = 10.41AKK267 pKa = 10.68KK268 pKa = 9.96VADD271 pKa = 3.96KK272 pKa = 10.27LAKK275 pKa = 9.49MKK277 pKa = 10.45NQNLL281 pKa = 3.62
Molecular weight: 29.41 kDa
Isoelectric point according different methods:
Protein with the highest isoelectric point:
>tr|G0WXQ1|G0WXQ1_9MONO Glycoprotein OS=Soybean cyst nematode socyvirus OX=1034377 PE=4 SV=1
MM1 pKa = 7.85SPMKK5 pKa = 10.59SSLDD9 pKa = 3.11PWRR12 pKa = 11.84IRR14 pKa = 11.84TSDD17 pKa = 3.49RR18 pKa = 11.84QALDD22 pKa = 3.34PGYY25 pKa = 7.72WTAEE29 pKa = 3.61RR30 pKa = 11.84RR31 pKa = 11.84QLRR34 pKa = 11.84DD35 pKa = 3.33LLTSITVSRR44 pKa = 11.84SPSPTSRR51 pKa = 11.84PTATVGTQTDD61 pKa = 4.06PAHH64 pKa = 6.55CMCCGKK70 pKa = 9.96VHH72 pKa = 6.78LVTYY76 pKa = 9.99KK77 pKa = 10.18IVHH80 pKa = 6.21
MM1 pKa = 7.85SPMKK5 pKa = 10.59SSLDD9 pKa = 3.11PWRR12 pKa = 11.84IRR14 pKa = 11.84TSDD17 pKa = 3.49RR18 pKa = 11.84QALDD22 pKa = 3.34PGYY25 pKa = 7.72WTAEE29 pKa = 3.61RR30 pKa = 11.84RR31 pKa = 11.84QLRR34 pKa = 11.84DD35 pKa = 3.33LLTSITVSRR44 pKa = 11.84SPSPTSRR51 pKa = 11.84PTATVGTQTDD61 pKa = 4.06PAHH64 pKa = 6.55CMCCGKK70 pKa = 9.96VHH72 pKa = 6.78LVTYY76 pKa = 9.99KK77 pKa = 10.18IVHH80 pKa = 6.21
Molecular weight: 9.0 kDa
Isoelectric point according different methods:
Peptides (in silico digests for buttom-up proteomics)
Below you can find in silico digests of the whole proteome with Trypsin, Chymotrypsin, Trypsin+LysC, LysN, ArgC proteases suitable for different mass spec machines.| Try ESI |
 |
|---|
| ChTry ESI |
 |
|---|
| ArgC ESI |
 |
|---|
| LysN ESI |
 |
|---|
| TryLysC ESI |
 |
|---|
| Try MALDI |
 |
|---|
| ChTry MALDI |
 |
|---|
| ArgC MALDI |
 |
|---|
| LysN MALDI |
 |
|---|
| TryLysC MALDI |
 |
|---|
| Try LTQ |
 |
|---|
| ChTry LTQ |
 |
|---|
| ArgC LTQ |
 |
|---|
| LysN LTQ |
 |
|---|
| TryLysC LTQ |
 |
|---|
| Try MSlow |
 |
|---|
| ChTry MSlow |
 |
|---|
| ArgC MSlow |
 |
|---|
| LysN MSlow |
 |
|---|
| TryLysC MSlow |
 |
|---|
| Try MShigh |
 |
|---|
| ChTry MShigh |
 |
|---|
| ArgC MShigh |
 |
|---|
| LysN MShigh |
 |
|---|
| TryLysC MShigh |
 |
|---|
General Statistics
Number of major isoforms |
Number of additional isoforms |
Number of all proteins |
Number of amino acids |
Min. Seq. Length |
Max. Seq. Length |
Avg. Seq. Length |
Avg. Mol. Weight |
|---|---|---|---|---|---|---|---|
0 |
3420 |
80 |
2086 |
684.0 |
76.13 |
Amino acid frequency
Ala |
Cys |
Asp |
Glu |
Phe |
Gly |
His |
Ile |
Lys |
Leu |
|---|---|---|---|---|---|---|---|---|---|
8.538 ± 1.754 | 1.901 ± 0.416 |
5.614 ± 0.329 | 5.234 ± 0.314 |
2.953 ± 0.528 | 6.023 ± 0.743 |
2.427 ± 0.135 | 5.351 ± 0.595 |
4.678 ± 0.391 | 10.731 ± 0.968 |
Met |
Asn |
Gln |
Pro |
Arg |
Ser |
Thr |
Val |
Trp |
Tyr |
|---|---|---|---|---|---|---|---|---|---|
2.953 ± 0.266 | 3.187 ± 0.37 |
6.491 ± 1.016 | 3.713 ± 0.381 |
6.14 ± 0.838 | 6.404 ± 0.688 |
7.164 ± 0.402 | 5.906 ± 0.231 |
1.696 ± 0.271 | 2.895 ± 0.434 |
Most of the basic statistics you can see at this page can be downloaded from this CSV file
Proteome-pI is available under Creative Commons Attribution-NoDerivs license, for more details see here
| Reference: Kozlowski LP. Proteome-pI 2.0: Proteome Isoelectric Point Database Update. Nucleic Acids Res. 2021, doi: 10.1093/nar/gkab944 | Contact: Lukasz P. Kozlowski |
