Tetrapisispora blattae (strain ATCC 34711 / CBS 6284 / DSM 70876 / NBRC 10599 / NRRL Y-10934 / UCD 77-7) (Yeast) (Kluyveromyces blattae)
Taxonomy: cellular organisms; Eukaryota; Opisthokonta; Fungi; Dikarya; Ascomycota; saccharomyceta; Saccharomycotina; Saccharomycetes; Saccharomycetales; Saccharomycetaceae; Tetrapisispora; Tetrapisispora blattae
Average proteome isoelectric point is 6.56
Get precalculated fractions of proteins

Virtual 2D-PAGE plot for 5385 proteins (isoelectric point calculated using IPC2_protein)
Get csv file with sequences according to given criteria:
* You can choose from 21 different methods for calculating isoelectric point
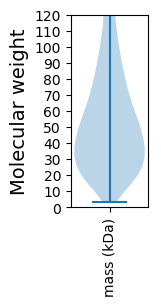
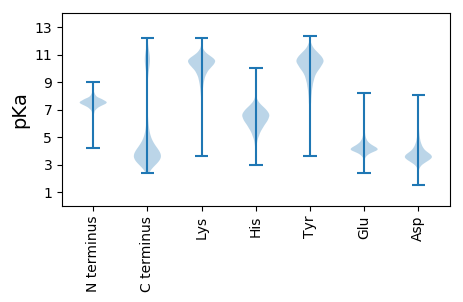
Summary statistics related to proteome-wise predictions


Protein with the lowest isoelectric point:
>tr|I2H1V5|I2H1V5_TETBL Uncharacterized protein OS=Tetrapisispora blattae (strain ATCC 34711 / CBS 6284 / DSM 70876 / NBRC 10599 / NRRL Y-10934 / UCD 77-7) OX=1071380 GN=TBLA0C05590 PE=4 SV=1
MM1 pKa = 7.49NLTPNIQLTQDD12 pKa = 3.64CAPAKK17 pKa = 10.65DD18 pKa = 3.87DD19 pKa = 3.85DD20 pKa = 4.48EE21 pKa = 6.07EE22 pKa = 4.64YY23 pKa = 10.77FSCISNLDD31 pKa = 3.29ATGQSSFQSKK41 pKa = 8.51QVLNNQLNPSKK52 pKa = 10.77YY53 pKa = 8.49YY54 pKa = 10.66NNLSFHH60 pKa = 7.0HH61 pKa = 6.18STVSSSSNSATTQFHH76 pKa = 6.7NISFKK81 pKa = 10.79KK82 pKa = 9.99KK83 pKa = 7.2QLKK86 pKa = 10.03FKK88 pKa = 10.5VFQKK92 pKa = 10.32CYY94 pKa = 9.61PRR96 pKa = 11.84TPVPQNEE103 pKa = 4.88GCCQDD108 pKa = 3.6YY109 pKa = 9.32TSLCLEE115 pKa = 4.44DD116 pKa = 4.79SNNEE120 pKa = 4.01EE121 pKa = 4.01YY122 pKa = 10.95DD123 pKa = 3.62DD124 pKa = 6.58DD125 pKa = 4.56EE126 pKa = 7.48DD127 pKa = 4.27EE128 pKa = 6.66DD129 pKa = 4.17EE130 pKa = 6.63DD131 pKa = 4.21EE132 pKa = 6.65DD133 pKa = 4.31EE134 pKa = 6.65DD135 pKa = 4.31EE136 pKa = 6.65DD137 pKa = 4.31EE138 pKa = 6.65DD139 pKa = 4.31EE140 pKa = 6.65DD141 pKa = 4.31EE142 pKa = 6.65DD143 pKa = 4.31EE144 pKa = 6.65DD145 pKa = 4.31EE146 pKa = 6.6DD147 pKa = 4.38EE148 pKa = 6.51DD149 pKa = 4.15EE150 pKa = 6.21DD151 pKa = 4.08EE152 pKa = 5.3YY153 pKa = 11.34EE154 pKa = 5.08YY155 pKa = 11.22EE156 pKa = 6.08DD157 pKa = 3.94EE158 pKa = 6.58DD159 pKa = 4.38EE160 pKa = 6.48DD161 pKa = 5.16EE162 pKa = 6.12DD163 pKa = 5.4EE164 pKa = 5.09DD165 pKa = 5.82DD166 pKa = 4.1EE167 pKa = 5.65GKK169 pKa = 11.09GSTGTYY175 pKa = 9.26YY176 pKa = 10.74RR177 pKa = 11.84KK178 pKa = 9.71QKK180 pKa = 10.06YY181 pKa = 8.85
MM1 pKa = 7.49NLTPNIQLTQDD12 pKa = 3.64CAPAKK17 pKa = 10.65DD18 pKa = 3.87DD19 pKa = 3.85DD20 pKa = 4.48EE21 pKa = 6.07EE22 pKa = 4.64YY23 pKa = 10.77FSCISNLDD31 pKa = 3.29ATGQSSFQSKK41 pKa = 8.51QVLNNQLNPSKK52 pKa = 10.77YY53 pKa = 8.49YY54 pKa = 10.66NNLSFHH60 pKa = 7.0HH61 pKa = 6.18STVSSSSNSATTQFHH76 pKa = 6.7NISFKK81 pKa = 10.79KK82 pKa = 9.99KK83 pKa = 7.2QLKK86 pKa = 10.03FKK88 pKa = 10.5VFQKK92 pKa = 10.32CYY94 pKa = 9.61PRR96 pKa = 11.84TPVPQNEE103 pKa = 4.88GCCQDD108 pKa = 3.6YY109 pKa = 9.32TSLCLEE115 pKa = 4.44DD116 pKa = 4.79SNNEE120 pKa = 4.01EE121 pKa = 4.01YY122 pKa = 10.95DD123 pKa = 3.62DD124 pKa = 6.58DD125 pKa = 4.56EE126 pKa = 7.48DD127 pKa = 4.27EE128 pKa = 6.66DD129 pKa = 4.17EE130 pKa = 6.63DD131 pKa = 4.21EE132 pKa = 6.65DD133 pKa = 4.31EE134 pKa = 6.65DD135 pKa = 4.31EE136 pKa = 6.65DD137 pKa = 4.31EE138 pKa = 6.65DD139 pKa = 4.31EE140 pKa = 6.65DD141 pKa = 4.31EE142 pKa = 6.65DD143 pKa = 4.31EE144 pKa = 6.65DD145 pKa = 4.31EE146 pKa = 6.6DD147 pKa = 4.38EE148 pKa = 6.51DD149 pKa = 4.15EE150 pKa = 6.21DD151 pKa = 4.08EE152 pKa = 5.3YY153 pKa = 11.34EE154 pKa = 5.08YY155 pKa = 11.22EE156 pKa = 6.08DD157 pKa = 3.94EE158 pKa = 6.58DD159 pKa = 4.38EE160 pKa = 6.48DD161 pKa = 5.16EE162 pKa = 6.12DD163 pKa = 5.4EE164 pKa = 5.09DD165 pKa = 5.82DD166 pKa = 4.1EE167 pKa = 5.65GKK169 pKa = 11.09GSTGTYY175 pKa = 9.26YY176 pKa = 10.74RR177 pKa = 11.84KK178 pKa = 9.71QKK180 pKa = 10.06YY181 pKa = 8.85
Molecular weight: 21.1 kDa
Isoelectric point according different methods:
Protein with the highest isoelectric point:
>tr|I2GY00|I2GY00_TETBL ATP-dependent RNA helicase DBP10 OS=Tetrapisispora blattae (strain ATCC 34711 / CBS 6284 / DSM 70876 / NBRC 10599 / NRRL Y-10934 / UCD 77-7) OX=1071380 GN=TBLA0B01590 PE=3 SV=1
MM1 pKa = 7.41LRR3 pKa = 11.84LIGLFAAPSHH13 pKa = 6.37LPAPLQLSLVRR24 pKa = 11.84GLHH27 pKa = 5.04KK28 pKa = 10.83LKK30 pKa = 10.93LKK32 pKa = 6.52THH34 pKa = 6.66KK35 pKa = 9.91GTLKK39 pKa = 9.0RR40 pKa = 11.84WRR42 pKa = 11.84RR43 pKa = 11.84RR44 pKa = 11.84VAPGGPAAEE53 pKa = 3.71QFVRR57 pKa = 11.84SKK59 pKa = 11.03AGRR62 pKa = 11.84NHH64 pKa = 6.8GNIGWSHH71 pKa = 6.66RR72 pKa = 11.84ALAALSRR79 pKa = 11.84RR80 pKa = 11.84VPAHH84 pKa = 4.89STHH87 pKa = 5.66VKK89 pKa = 10.24ALRR92 pKa = 11.84KK93 pKa = 9.48LLPYY97 pKa = 10.64
MM1 pKa = 7.41LRR3 pKa = 11.84LIGLFAAPSHH13 pKa = 6.37LPAPLQLSLVRR24 pKa = 11.84GLHH27 pKa = 5.04KK28 pKa = 10.83LKK30 pKa = 10.93LKK32 pKa = 6.52THH34 pKa = 6.66KK35 pKa = 9.91GTLKK39 pKa = 9.0RR40 pKa = 11.84WRR42 pKa = 11.84RR43 pKa = 11.84RR44 pKa = 11.84VAPGGPAAEE53 pKa = 3.71QFVRR57 pKa = 11.84SKK59 pKa = 11.03AGRR62 pKa = 11.84NHH64 pKa = 6.8GNIGWSHH71 pKa = 6.66RR72 pKa = 11.84ALAALSRR79 pKa = 11.84RR80 pKa = 11.84VPAHH84 pKa = 4.89STHH87 pKa = 5.66VKK89 pKa = 10.24ALRR92 pKa = 11.84KK93 pKa = 9.48LLPYY97 pKa = 10.64
Molecular weight: 10.8 kDa
Isoelectric point according different methods:
Peptides (in silico digests for buttom-up proteomics)
Below you can find in silico digests of the whole proteome with Trypsin, Chymotrypsin, Trypsin+LysC, LysN, ArgC proteases suitable for different mass spec machines.| Try ESI |
 |
|---|
| ChTry ESI |
 |
|---|
| ArgC ESI |
 |
|---|
| LysN ESI |
 |
|---|
| TryLysC ESI |
 |
|---|
| Try MALDI |
 |
|---|
| ChTry MALDI |
 |
|---|
| ArgC MALDI |
 |
|---|
| LysN MALDI |
 |
|---|
| TryLysC MALDI |
 |
|---|
| Try LTQ |
 |
|---|
| ChTry LTQ |
 |
|---|
| ArgC LTQ |
 |
|---|
| LysN LTQ |
 |
|---|
| TryLysC LTQ |
 |
|---|
| Try MSlow |
 |
|---|
| ChTry MSlow |
 |
|---|
| ArgC MSlow |
 |
|---|
| LysN MSlow |
 |
|---|
| TryLysC MSlow |
 |
|---|
| Try MShigh |
 |
|---|
| ChTry MShigh |
 |
|---|
| ArgC MShigh |
 |
|---|
| LysN MShigh |
 |
|---|
| TryLysC MShigh |
 |
|---|
General Statistics
Number of major isoforms |
Number of additional isoforms |
Number of all proteins |
Number of amino acids |
Min. Seq. Length |
Max. Seq. Length |
Avg. Seq. Length |
Avg. Mol. Weight |
|---|---|---|---|---|---|---|---|
0 |
2914559 |
25 |
4917 |
541.2 |
61.34 |
Amino acid frequency
Ala |
Cys |
Asp |
Glu |
Phe |
Gly |
His |
Ile |
Lys |
Leu |
|---|---|---|---|---|---|---|---|---|---|
4.67 ± 0.034 | 1.11 ± 0.011 |
5.905 ± 0.026 | 6.121 ± 0.035 |
4.321 ± 0.022 | 4.377 ± 0.029 |
2.059 ± 0.013 | 7.524 ± 0.035 |
7.435 ± 0.037 | 9.365 ± 0.039 |
Met |
Asn |
Gln |
Pro |
Arg |
Ser |
Thr |
Val |
Trp |
Tyr |
|---|---|---|---|---|---|---|---|---|---|
1.978 ± 0.011 | 8.044 ± 0.059 |
4.251 ± 0.026 | 3.96 ± 0.03 |
3.866 ± 0.02 | 9.456 ± 0.053 |
6.352 ± 0.038 | 4.836 ± 0.026 |
0.937 ± 0.009 | 3.43 ± 0.02 |
Most of the basic statistics you can see at this page can be downloaded from this CSV file
Proteome-pI is available under Creative Commons Attribution-NoDerivs license, for more details see here
| Reference: Kozlowski LP. Proteome-pI 2.0: Proteome Isoelectric Point Database Update. Nucleic Acids Res. 2021, doi: 10.1093/nar/gkab944 | Contact: Lukasz P. Kozlowski |
