Phycicoccus sp. CMS6Z-2
Taxonomy: cellular organisms; Bacteria; Terrabacteria group; Actinobacteria; Actinomycetia; Micrococcales; Intrasporangiaceae; Phycicoccus
Average proteome isoelectric point is 6.17
Get precalculated fractions of proteins

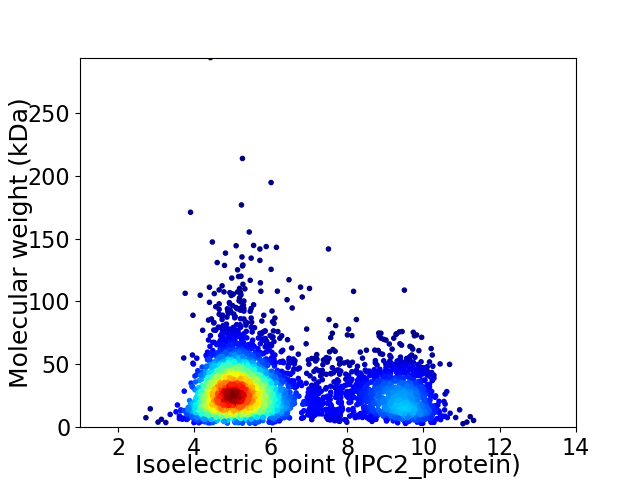
Virtual 2D-PAGE plot for 4413 proteins (isoelectric point calculated using IPC2_protein)
Get csv file with sequences according to given criteria:
* You can choose from 21 different methods for calculating isoelectric point
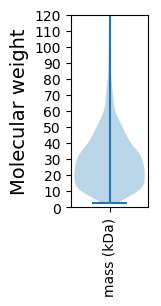
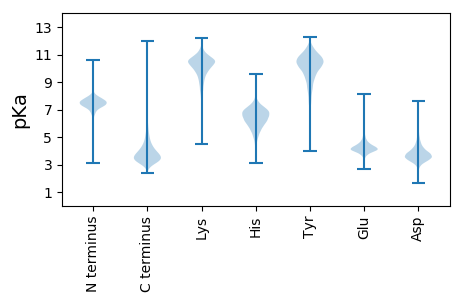
Summary statistics related to proteome-wise predictions


Protein with the lowest isoelectric point:
>tr|A0A444BN28|A0A444BN28_9MICO SDR family NAD(P)-dependent oxidoreductase OS=Phycicoccus sp. CMS6Z-2 OX=2502783 GN=EPD83_09150 PE=3 SV=1
MM1 pKa = 7.19TRR3 pKa = 11.84RR4 pKa = 11.84SPRR7 pKa = 11.84LQTDD11 pKa = 3.6RR12 pKa = 11.84PTYY15 pKa = 9.47EE16 pKa = 3.92GRR18 pKa = 11.84VLPRR22 pKa = 11.84PDD24 pKa = 4.03EE25 pKa = 4.17EE26 pKa = 5.25VVDD29 pKa = 3.66QGLAFDD35 pKa = 5.66LGTLLDD41 pKa = 3.81RR42 pKa = 11.84RR43 pKa = 11.84RR44 pKa = 11.84ALQVLGIGAAGGVLAACGTSSGGGATATASASATASATATAGAADD89 pKa = 3.98AADD92 pKa = 3.86TTLTEE97 pKa = 4.7IPDD100 pKa = 3.91EE101 pKa = 4.36TAGPYY106 pKa = 10.2PGDD109 pKa = 3.75GSNGADD115 pKa = 3.23VLEE118 pKa = 4.11QSGVVRR124 pKa = 11.84SDD126 pKa = 2.68ITASFGDD133 pKa = 4.19ASATAPGIPMTLTLTLLDD151 pKa = 3.74IAGGGAPMTGAAVYY165 pKa = 9.68VWHH168 pKa = 7.43CDD170 pKa = 3.2ALGQYY175 pKa = 10.92SMYY178 pKa = 9.62SQAVVGEE185 pKa = 4.06NYY187 pKa = 10.26LRR189 pKa = 11.84GVQVTDD195 pKa = 3.21DD196 pKa = 3.56TGAVTFTSVFPGCYY210 pKa = 8.86SGRR213 pKa = 11.84WPHH216 pKa = 5.27VHH218 pKa = 6.32FEE220 pKa = 4.47VYY222 pKa = 10.32PSVDD226 pKa = 4.55DD227 pKa = 3.74ITDD230 pKa = 3.44ASNAICTSQVALPKK244 pKa = 10.08GASDD248 pKa = 4.12AVYY251 pKa = 10.92ALDD254 pKa = 5.4DD255 pKa = 4.18YY256 pKa = 11.35PGSAQNLSSMSLTGDD271 pKa = 3.26NVFGDD276 pKa = 4.21DD277 pKa = 4.53GGVHH281 pKa = 5.78QLATVTGDD289 pKa = 3.16TSGYY293 pKa = 8.07TVALSVPIDD302 pKa = 3.56TATAPTAGGAPGGGQPPAPPSSS324 pKa = 3.34
MM1 pKa = 7.19TRR3 pKa = 11.84RR4 pKa = 11.84SPRR7 pKa = 11.84LQTDD11 pKa = 3.6RR12 pKa = 11.84PTYY15 pKa = 9.47EE16 pKa = 3.92GRR18 pKa = 11.84VLPRR22 pKa = 11.84PDD24 pKa = 4.03EE25 pKa = 4.17EE26 pKa = 5.25VVDD29 pKa = 3.66QGLAFDD35 pKa = 5.66LGTLLDD41 pKa = 3.81RR42 pKa = 11.84RR43 pKa = 11.84RR44 pKa = 11.84ALQVLGIGAAGGVLAACGTSSGGGATATASASATASATATAGAADD89 pKa = 3.98AADD92 pKa = 3.86TTLTEE97 pKa = 4.7IPDD100 pKa = 3.91EE101 pKa = 4.36TAGPYY106 pKa = 10.2PGDD109 pKa = 3.75GSNGADD115 pKa = 3.23VLEE118 pKa = 4.11QSGVVRR124 pKa = 11.84SDD126 pKa = 2.68ITASFGDD133 pKa = 4.19ASATAPGIPMTLTLTLLDD151 pKa = 3.74IAGGGAPMTGAAVYY165 pKa = 9.68VWHH168 pKa = 7.43CDD170 pKa = 3.2ALGQYY175 pKa = 10.92SMYY178 pKa = 9.62SQAVVGEE185 pKa = 4.06NYY187 pKa = 10.26LRR189 pKa = 11.84GVQVTDD195 pKa = 3.21DD196 pKa = 3.56TGAVTFTSVFPGCYY210 pKa = 8.86SGRR213 pKa = 11.84WPHH216 pKa = 5.27VHH218 pKa = 6.32FEE220 pKa = 4.47VYY222 pKa = 10.32PSVDD226 pKa = 4.55DD227 pKa = 3.74ITDD230 pKa = 3.44ASNAICTSQVALPKK244 pKa = 10.08GASDD248 pKa = 4.12AVYY251 pKa = 10.92ALDD254 pKa = 5.4DD255 pKa = 4.18YY256 pKa = 11.35PGSAQNLSSMSLTGDD271 pKa = 3.26NVFGDD276 pKa = 4.21DD277 pKa = 4.53GGVHH281 pKa = 5.78QLATVTGDD289 pKa = 3.16TSGYY293 pKa = 8.07TVALSVPIDD302 pKa = 3.56TATAPTAGGAPGGGQPPAPPSSS324 pKa = 3.34
Molecular weight: 32.48 kDa
Isoelectric point according different methods:
Protein with the highest isoelectric point:
>tr|A0A444BHA2|A0A444BHA2_9MICO Histidine kinase OS=Phycicoccus sp. CMS6Z-2 OX=2502783 GN=EPD83_17105 PE=4 SV=1
MM1 pKa = 7.69SKK3 pKa = 9.0RR4 pKa = 11.84TFQPNNRR11 pKa = 11.84RR12 pKa = 11.84RR13 pKa = 11.84AKK15 pKa = 9.45VHH17 pKa = 5.31GFRR20 pKa = 11.84LRR22 pKa = 11.84MRR24 pKa = 11.84TRR26 pKa = 11.84AGRR29 pKa = 11.84SILANRR35 pKa = 11.84RR36 pKa = 11.84RR37 pKa = 11.84KK38 pKa = 9.93GRR40 pKa = 11.84AQLSAA45 pKa = 3.87
MM1 pKa = 7.69SKK3 pKa = 9.0RR4 pKa = 11.84TFQPNNRR11 pKa = 11.84RR12 pKa = 11.84RR13 pKa = 11.84AKK15 pKa = 9.45VHH17 pKa = 5.31GFRR20 pKa = 11.84LRR22 pKa = 11.84MRR24 pKa = 11.84TRR26 pKa = 11.84AGRR29 pKa = 11.84SILANRR35 pKa = 11.84RR36 pKa = 11.84RR37 pKa = 11.84KK38 pKa = 9.93GRR40 pKa = 11.84AQLSAA45 pKa = 3.87
Molecular weight: 5.36 kDa
Isoelectric point according different methods:
Peptides (in silico digests for buttom-up proteomics)
Below you can find in silico digests of the whole proteome with Trypsin, Chymotrypsin, Trypsin+LysC, LysN, ArgC proteases suitable for different mass spec machines.| Try ESI |
 |
|---|
| ChTry ESI |
 |
|---|
| ArgC ESI |
 |
|---|
| LysN ESI |
 |
|---|
| TryLysC ESI |
 |
|---|
| Try MALDI |
 |
|---|
| ChTry MALDI |
 |
|---|
| ArgC MALDI |
 |
|---|
| LysN MALDI |
 |
|---|
| TryLysC MALDI |
 |
|---|
| Try LTQ |
 |
|---|
| ChTry LTQ |
 |
|---|
| ArgC LTQ |
 |
|---|
| LysN LTQ |
 |
|---|
| TryLysC LTQ |
 |
|---|
| Try MSlow |
 |
|---|
| ChTry MSlow |
 |
|---|
| ArgC MSlow |
 |
|---|
| LysN MSlow |
 |
|---|
| TryLysC MSlow |
 |
|---|
| Try MShigh |
 |
|---|
| ChTry MShigh |
 |
|---|
| ArgC MShigh |
 |
|---|
| LysN MShigh |
 |
|---|
| TryLysC MShigh |
 |
|---|
General Statistics
Number of major isoforms |
Number of additional isoforms |
Number of all proteins |
Number of amino acids |
Min. Seq. Length |
Max. Seq. Length |
Avg. Seq. Length |
Avg. Mol. Weight |
|---|---|---|---|---|---|---|---|
0 |
1282195 |
24 |
2844 |
290.5 |
30.92 |
Amino acid frequency
Ala |
Cys |
Asp |
Glu |
Phe |
Gly |
His |
Ile |
Lys |
Leu |
|---|---|---|---|---|---|---|---|---|---|
13.692 ± 0.052 | 0.673 ± 0.009 |
6.657 ± 0.034 | 5.531 ± 0.037 |
2.533 ± 0.024 | 9.732 ± 0.033 |
2.211 ± 0.022 | 2.506 ± 0.03 |
1.511 ± 0.03 | 10.227 ± 0.044 |
Met |
Asn |
Gln |
Pro |
Arg |
Ser |
Thr |
Val |
Trp |
Tyr |
|---|---|---|---|---|---|---|---|---|---|
1.675 ± 0.016 | 1.418 ± 0.019 |
6.023 ± 0.03 | 2.345 ± 0.023 |
8.402 ± 0.043 | 4.98 ± 0.029 |
6.2 ± 0.037 | 10.321 ± 0.037 |
1.555 ± 0.015 | 1.808 ± 0.019 |
Most of the basic statistics you can see at this page can be downloaded from this CSV file
Proteome-pI is available under Creative Commons Attribution-NoDerivs license, for more details see here
| Reference: Kozlowski LP. Proteome-pI 2.0: Proteome Isoelectric Point Database Update. Nucleic Acids Res. 2021, doi: 10.1093/nar/gkab944 | Contact: Lukasz P. Kozlowski |
