Tilapia lake virus
Taxonomy: Viruses; Riboviria; Orthornavirae; Negarnaviricota; Polyploviricotina; Insthoviricetes; Articulavirales; Amnoonviridae; Tilapinevirus; Tilapia tilapinevirus
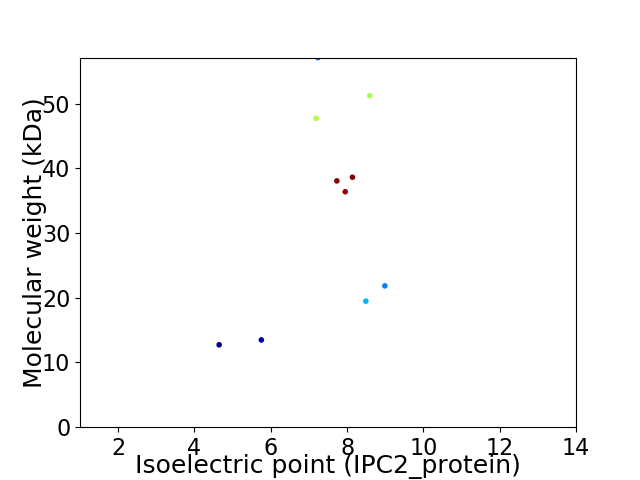
Average proteome isoelectric point is 7.4
Get precalculated fractions of proteins

Virtual 2D-PAGE plot for 10 proteins (isoelectric point calculated using IPC2_protein)
Get csv file with sequences according to given criteria:
* You can choose from 21 different methods for calculating isoelectric point
Summary statistics related to proteome-wise predictions


Protein with the lowest isoelectric point:
>tr|A0A142I800|A0A142I800_9VIRU Uncharacterized protein OS=Tilapia lake virus OX=1549864 PE=4 SV=1
MM1 pKa = 7.37SVADD5 pKa = 4.2YY6 pKa = 10.85LSSDD10 pKa = 3.63SDD12 pKa = 3.72SGAEE16 pKa = 3.97SSGCLVLRR24 pKa = 11.84SRR26 pKa = 11.84KK27 pKa = 8.93IKK29 pKa = 10.12KK30 pKa = 9.3GKK32 pKa = 9.5KK33 pKa = 8.26AASKK37 pKa = 10.05KK38 pKa = 10.17RR39 pKa = 11.84SWKK42 pKa = 9.18NEE44 pKa = 3.39RR45 pKa = 11.84YY46 pKa = 9.73GADD49 pKa = 3.24EE50 pKa = 4.28SGEE53 pKa = 4.41DD54 pKa = 3.54NIEE57 pKa = 3.82WGDD60 pKa = 3.92EE61 pKa = 3.88VDD63 pKa = 6.56LEE65 pKa = 4.72MDD67 pKa = 4.45DD68 pKa = 4.7CDD70 pKa = 4.28SAIPEE75 pKa = 4.08WARR78 pKa = 11.84VDD80 pKa = 4.36FNPKK84 pKa = 8.84NRR86 pKa = 11.84RR87 pKa = 11.84DD88 pKa = 3.85RR89 pKa = 11.84EE90 pKa = 4.03DD91 pKa = 4.82DD92 pKa = 3.81GQSDD96 pKa = 4.22LSRR99 pKa = 11.84FSEE102 pKa = 4.31DD103 pKa = 3.03FGKK106 pKa = 10.83KK107 pKa = 10.1SLDD110 pKa = 3.54VQSS113 pKa = 3.81
MM1 pKa = 7.37SVADD5 pKa = 4.2YY6 pKa = 10.85LSSDD10 pKa = 3.63SDD12 pKa = 3.72SGAEE16 pKa = 3.97SSGCLVLRR24 pKa = 11.84SRR26 pKa = 11.84KK27 pKa = 8.93IKK29 pKa = 10.12KK30 pKa = 9.3GKK32 pKa = 9.5KK33 pKa = 8.26AASKK37 pKa = 10.05KK38 pKa = 10.17RR39 pKa = 11.84SWKK42 pKa = 9.18NEE44 pKa = 3.39RR45 pKa = 11.84YY46 pKa = 9.73GADD49 pKa = 3.24EE50 pKa = 4.28SGEE53 pKa = 4.41DD54 pKa = 3.54NIEE57 pKa = 3.82WGDD60 pKa = 3.92EE61 pKa = 3.88VDD63 pKa = 6.56LEE65 pKa = 4.72MDD67 pKa = 4.45DD68 pKa = 4.7CDD70 pKa = 4.28SAIPEE75 pKa = 4.08WARR78 pKa = 11.84VDD80 pKa = 4.36FNPKK84 pKa = 8.84NRR86 pKa = 11.84RR87 pKa = 11.84DD88 pKa = 3.85RR89 pKa = 11.84EE90 pKa = 4.03DD91 pKa = 4.82DD92 pKa = 3.81GQSDD96 pKa = 4.22LSRR99 pKa = 11.84FSEE102 pKa = 4.31DD103 pKa = 3.03FGKK106 pKa = 10.83KK107 pKa = 10.1SLDD110 pKa = 3.54VQSS113 pKa = 3.81
Molecular weight: 12.73 kDa
Isoelectric point according different methods:
Protein with the highest isoelectric point:
>tr|A0A142I7Z8|A0A142I7Z8_9VIRU Uncharacterized protein OS=Tilapia lake virus OX=1549864 PE=4 SV=1
MM1 pKa = 7.53SYY3 pKa = 10.78KK4 pKa = 9.97IGEE7 pKa = 4.42LEE9 pKa = 4.81RR10 pKa = 11.84IITRR14 pKa = 11.84KK15 pKa = 8.16NTLPKK20 pKa = 10.63DD21 pKa = 3.62SGSQTGLFHH30 pKa = 7.94RR31 pKa = 11.84LLLEE35 pKa = 4.54HH36 pKa = 6.79YY37 pKa = 10.19SGASNVWFFCATGFTPNTNGTTWIVLTSHH66 pKa = 6.64PTDD69 pKa = 3.64GGEE72 pKa = 4.59KK73 pKa = 10.64VPLKK77 pKa = 9.78WKK79 pKa = 10.55YY80 pKa = 9.41EE81 pKa = 4.03VSPGLPVRR89 pKa = 11.84RR90 pKa = 11.84VLAQEE95 pKa = 4.16GTAVRR100 pKa = 11.84GPKK103 pKa = 9.62GAYY106 pKa = 8.74LVKK109 pKa = 10.73GDD111 pKa = 3.85MHH113 pKa = 6.81LCSTTFYY120 pKa = 10.36TRR122 pKa = 11.84RR123 pKa = 11.84EE124 pKa = 3.89AKK126 pKa = 9.92YY127 pKa = 8.61WLCAPSPKK135 pKa = 9.64FPHH138 pKa = 4.8WTKK141 pKa = 10.79RR142 pKa = 11.84SALVTSTRR150 pKa = 11.84PLTEE154 pKa = 4.2LSRR157 pKa = 11.84VATYY161 pKa = 10.96LEE163 pKa = 5.11AISKK167 pKa = 10.21GATDD171 pKa = 5.04VNEE174 pKa = 4.41SWCSYY179 pKa = 9.81HH180 pKa = 7.4RR181 pKa = 11.84VGLVPIPKK189 pKa = 10.42GITFEE194 pKa = 4.28LL195 pKa = 4.17
MM1 pKa = 7.53SYY3 pKa = 10.78KK4 pKa = 9.97IGEE7 pKa = 4.42LEE9 pKa = 4.81RR10 pKa = 11.84IITRR14 pKa = 11.84KK15 pKa = 8.16NTLPKK20 pKa = 10.63DD21 pKa = 3.62SGSQTGLFHH30 pKa = 7.94RR31 pKa = 11.84LLLEE35 pKa = 4.54HH36 pKa = 6.79YY37 pKa = 10.19SGASNVWFFCATGFTPNTNGTTWIVLTSHH66 pKa = 6.64PTDD69 pKa = 3.64GGEE72 pKa = 4.59KK73 pKa = 10.64VPLKK77 pKa = 9.78WKK79 pKa = 10.55YY80 pKa = 9.41EE81 pKa = 4.03VSPGLPVRR89 pKa = 11.84RR90 pKa = 11.84VLAQEE95 pKa = 4.16GTAVRR100 pKa = 11.84GPKK103 pKa = 9.62GAYY106 pKa = 8.74LVKK109 pKa = 10.73GDD111 pKa = 3.85MHH113 pKa = 6.81LCSTTFYY120 pKa = 10.36TRR122 pKa = 11.84RR123 pKa = 11.84EE124 pKa = 3.89AKK126 pKa = 9.92YY127 pKa = 8.61WLCAPSPKK135 pKa = 9.64FPHH138 pKa = 4.8WTKK141 pKa = 10.79RR142 pKa = 11.84SALVTSTRR150 pKa = 11.84PLTEE154 pKa = 4.2LSRR157 pKa = 11.84VATYY161 pKa = 10.96LEE163 pKa = 5.11AISKK167 pKa = 10.21GATDD171 pKa = 5.04VNEE174 pKa = 4.41SWCSYY179 pKa = 9.81HH180 pKa = 7.4RR181 pKa = 11.84VGLVPIPKK189 pKa = 10.42GITFEE194 pKa = 4.28LL195 pKa = 4.17
Molecular weight: 21.83 kDa
Isoelectric point according different methods:
Peptides (in silico digests for buttom-up proteomics)
Below you can find in silico digests of the whole proteome with Trypsin, Chymotrypsin, Trypsin+LysC, LysN, ArgC proteases suitable for different mass spec machines.| Try ESI |
 |
|---|
| ChTry ESI |
 |
|---|
| ArgC ESI |
 |
|---|
| LysN ESI |
 |
|---|
| TryLysC ESI |
 |
|---|
| Try MALDI |
 |
|---|
| ChTry MALDI |
 |
|---|
| ArgC MALDI |
 |
|---|
| LysN MALDI |
 |
|---|
| TryLysC MALDI |
 |
|---|
| Try LTQ |
 |
|---|
| ChTry LTQ |
 |
|---|
| ArgC LTQ |
 |
|---|
| LysN LTQ |
 |
|---|
| TryLysC LTQ |
 |
|---|
| Try MSlow |
 |
|---|
| ChTry MSlow |
 |
|---|
| ArgC MSlow |
 |
|---|
| LysN MSlow |
 |
|---|
| TryLysC MSlow |
 |
|---|
| Try MShigh |
 |
|---|
| ChTry MShigh |
 |
|---|
| ArgC MShigh |
 |
|---|
| LysN MShigh |
 |
|---|
| TryLysC MShigh |
 |
|---|
General Statistics
Number of major isoforms |
Number of additional isoforms |
Number of all proteins |
Number of amino acids |
Min. Seq. Length |
Max. Seq. Length |
Avg. Seq. Length |
Avg. Mol. Weight |
|---|---|---|---|---|---|---|---|
0 |
3011 |
113 |
519 |
301.1 |
33.66 |
Amino acid frequency
Ala |
Cys |
Asp |
Glu |
Phe |
Gly |
His |
Ile |
Lys |
Leu |
|---|---|---|---|---|---|---|---|---|---|
7.207 ± 0.735 | 2.989 ± 0.245 |
5.214 ± 0.449 | 6.011 ± 0.322 |
3.886 ± 0.363 | 6.476 ± 0.282 |
2.026 ± 0.233 | 4.417 ± 0.281 |
6.244 ± 0.369 | 10.096 ± 0.441 |
Met |
Asn |
Gln |
Pro |
Arg |
Ser |
Thr |
Val |
Trp |
Tyr |
|---|---|---|---|---|---|---|---|---|---|
2.424 ± 0.302 | 2.889 ± 0.297 |
4.218 ± 0.304 | 3.022 ± 0.244 |
6.808 ± 0.299 | 9.034 ± 0.662 |
5.679 ± 0.609 | 6.842 ± 0.267 |
1.362 ± 0.252 | 3.155 ± 0.344 |
Most of the basic statistics you can see at this page can be downloaded from this CSV file
Proteome-pI is available under Creative Commons Attribution-NoDerivs license, for more details see here
| Reference: Kozlowski LP. Proteome-pI 2.0: Proteome Isoelectric Point Database Update. Nucleic Acids Res. 2021, doi: 10.1093/nar/gkab944 | Contact: Lukasz P. Kozlowski |
