marine actinobacterium PHSC20C1
Taxonomy: cellular organisms; Bacteria; Terrabacteria group; Actinobacteria; Actinomycetia; unclassified Actinomycetia
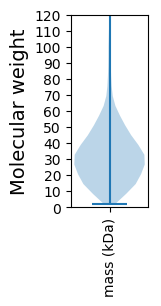
Average proteome isoelectric point is 5.96
Get precalculated fractions of proteins

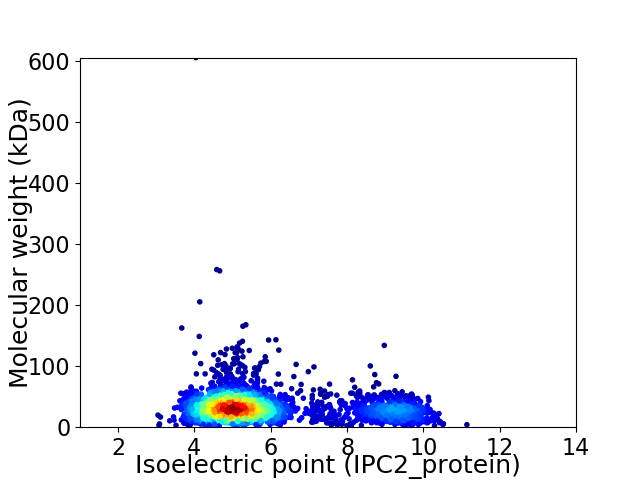
Virtual 2D-PAGE plot for 2668 proteins (isoelectric point calculated using IPC2_protein)
Get csv file with sequences according to given criteria:
* You can choose from 21 different methods for calculating isoelectric point
Summary statistics related to proteome-wise predictions


Protein with the lowest isoelectric point:
>tr|A4AGK1|A4AGK1_9ACTN Glutamate 5-kinase OS=marine actinobacterium PHSC20C1 OX=312284 GN=proB PE=3 SV=1
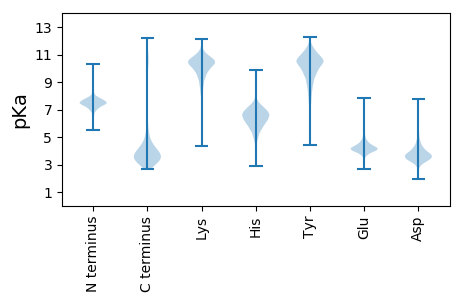
MM1 pKa = 7.26SRR3 pKa = 11.84SKK5 pKa = 10.63FFSLSTVAAAGVLAITLAGCSAPAEE30 pKa = 4.34DD31 pKa = 5.04AAPADD36 pKa = 3.97GTLGSLTVGATATPAGEE53 pKa = 3.75IVQFVIDD60 pKa = 4.07SGQAADD66 pKa = 5.24AGLEE70 pKa = 3.85LDD72 pKa = 3.29IVEE75 pKa = 4.53FTDD78 pKa = 3.65YY79 pKa = 7.69TTPNPALSEE88 pKa = 4.18GSLDD92 pKa = 3.55VNLFQHH98 pKa = 6.59EE99 pKa = 4.56PFLDD103 pKa = 4.4LYY105 pKa = 11.47NEE107 pKa = 4.12NTGDD111 pKa = 3.55NLFVVGQVYY120 pKa = 9.94LPPLALYY127 pKa = 10.54SKK129 pKa = 9.54TVDD132 pKa = 3.34EE133 pKa = 5.4LADD136 pKa = 4.09LKK138 pKa = 11.27DD139 pKa = 3.74GANIALPNDD148 pKa = 3.33ASNEE152 pKa = 3.62GRR154 pKa = 11.84ALLLLADD161 pKa = 4.43AGIIEE166 pKa = 4.6TTDD169 pKa = 3.4TPSTVADD176 pKa = 3.54ITANPHH182 pKa = 6.65DD183 pKa = 4.49YY184 pKa = 11.45NFIEE188 pKa = 5.16IDD190 pKa = 3.53AASLPSALDD199 pKa = 3.75DD200 pKa = 3.46QDD202 pKa = 3.84AAIVNFNYY210 pKa = 10.53AGAAGLTGDD219 pKa = 4.26LQLVTEE225 pKa = 4.83PTTSSYY231 pKa = 11.71YY232 pKa = 8.73NTLVTRR238 pKa = 11.84DD239 pKa = 3.84EE240 pKa = 4.64LKK242 pKa = 10.62SDD244 pKa = 3.33PRR246 pKa = 11.84VLKK249 pKa = 10.58LYY251 pKa = 10.5EE252 pKa = 4.69LLTSDD257 pKa = 3.55EE258 pKa = 4.12TKK260 pKa = 10.62AYY262 pKa = 9.88INEE265 pKa = 4.73FYY267 pKa = 10.62AGLVIPVSS275 pKa = 3.57
MM1 pKa = 7.26SRR3 pKa = 11.84SKK5 pKa = 10.63FFSLSTVAAAGVLAITLAGCSAPAEE30 pKa = 4.34DD31 pKa = 5.04AAPADD36 pKa = 3.97GTLGSLTVGATATPAGEE53 pKa = 3.75IVQFVIDD60 pKa = 4.07SGQAADD66 pKa = 5.24AGLEE70 pKa = 3.85LDD72 pKa = 3.29IVEE75 pKa = 4.53FTDD78 pKa = 3.65YY79 pKa = 7.69TTPNPALSEE88 pKa = 4.18GSLDD92 pKa = 3.55VNLFQHH98 pKa = 6.59EE99 pKa = 4.56PFLDD103 pKa = 4.4LYY105 pKa = 11.47NEE107 pKa = 4.12NTGDD111 pKa = 3.55NLFVVGQVYY120 pKa = 9.94LPPLALYY127 pKa = 10.54SKK129 pKa = 9.54TVDD132 pKa = 3.34EE133 pKa = 5.4LADD136 pKa = 4.09LKK138 pKa = 11.27DD139 pKa = 3.74GANIALPNDD148 pKa = 3.33ASNEE152 pKa = 3.62GRR154 pKa = 11.84ALLLLADD161 pKa = 4.43AGIIEE166 pKa = 4.6TTDD169 pKa = 3.4TPSTVADD176 pKa = 3.54ITANPHH182 pKa = 6.65DD183 pKa = 4.49YY184 pKa = 11.45NFIEE188 pKa = 5.16IDD190 pKa = 3.53AASLPSALDD199 pKa = 3.75DD200 pKa = 3.46QDD202 pKa = 3.84AAIVNFNYY210 pKa = 10.53AGAAGLTGDD219 pKa = 4.26LQLVTEE225 pKa = 4.83PTTSSYY231 pKa = 11.71YY232 pKa = 8.73NTLVTRR238 pKa = 11.84DD239 pKa = 3.84EE240 pKa = 4.64LKK242 pKa = 10.62SDD244 pKa = 3.33PRR246 pKa = 11.84VLKK249 pKa = 10.58LYY251 pKa = 10.5EE252 pKa = 4.69LLTSDD257 pKa = 3.55EE258 pKa = 4.12TKK260 pKa = 10.62AYY262 pKa = 9.88INEE265 pKa = 4.73FYY267 pKa = 10.62AGLVIPVSS275 pKa = 3.57
Molecular weight: 28.91 kDa
Isoelectric point according different methods:
Protein with the highest isoelectric point:
>tr|A4AIY5|A4AIY5_9ACTN Thiol:disulfide interchange protein OS=marine actinobacterium PHSC20C1 OX=312284 GN=A20C1_11271 PE=4 SV=1
MM1 pKa = 7.4GSVIKK6 pKa = 10.42KK7 pKa = 8.47RR8 pKa = 11.84RR9 pKa = 11.84KK10 pKa = 9.22RR11 pKa = 11.84MAKK14 pKa = 9.41KK15 pKa = 9.87KK16 pKa = 9.7HH17 pKa = 5.84RR18 pKa = 11.84KK19 pKa = 8.56LLRR22 pKa = 11.84KK23 pKa = 7.78TRR25 pKa = 11.84HH26 pKa = 3.65QRR28 pKa = 11.84RR29 pKa = 11.84NKK31 pKa = 9.78KK32 pKa = 9.85
MM1 pKa = 7.4GSVIKK6 pKa = 10.42KK7 pKa = 8.47RR8 pKa = 11.84RR9 pKa = 11.84KK10 pKa = 9.22RR11 pKa = 11.84MAKK14 pKa = 9.41KK15 pKa = 9.87KK16 pKa = 9.7HH17 pKa = 5.84RR18 pKa = 11.84KK19 pKa = 8.56LLRR22 pKa = 11.84KK23 pKa = 7.78TRR25 pKa = 11.84HH26 pKa = 3.65QRR28 pKa = 11.84RR29 pKa = 11.84NKK31 pKa = 9.78KK32 pKa = 9.85
Molecular weight: 4.08 kDa
Isoelectric point according different methods:
Peptides (in silico digests for buttom-up proteomics)
Below you can find in silico digests of the whole proteome with Trypsin, Chymotrypsin, Trypsin+LysC, LysN, ArgC proteases suitable for different mass spec machines.| Try ESI |
 |
|---|
| ChTry ESI |
 |
|---|
| ArgC ESI |
 |
|---|
| LysN ESI |
 |
|---|
| TryLysC ESI |
 |
|---|
| Try MALDI |
 |
|---|
| ChTry MALDI |
 |
|---|
| ArgC MALDI |
 |
|---|
| LysN MALDI |
 |
|---|
| TryLysC MALDI |
 |
|---|
| Try LTQ |
 |
|---|
| ChTry LTQ |
 |
|---|
| ArgC LTQ |
 |
|---|
| LysN LTQ |
 |
|---|
| TryLysC LTQ |
 |
|---|
| Try MSlow |
 |
|---|
| ChTry MSlow |
 |
|---|
| ArgC MSlow |
 |
|---|
| LysN MSlow |
 |
|---|
| TryLysC MSlow |
 |
|---|
| Try MShigh |
 |
|---|
| ChTry MShigh |
 |
|---|
| ArgC MShigh |
 |
|---|
| LysN MShigh |
 |
|---|
| TryLysC MShigh |
 |
|---|
General Statistics
Number of major isoforms |
Number of additional isoforms |
Number of all proteins |
Number of amino acids |
Min. Seq. Length |
Max. Seq. Length |
Avg. Seq. Length |
Avg. Mol. Weight |
|---|---|---|---|---|---|---|---|
0 |
851365 |
22 |
6077 |
319.1 |
34.25 |
Amino acid frequency
Ala |
Cys |
Asp |
Glu |
Phe |
Gly |
His |
Ile |
Lys |
Leu |
|---|---|---|---|---|---|---|---|---|---|
12.478 ± 0.054 | 0.484 ± 0.012 |
5.856 ± 0.039 | 5.778 ± 0.052 |
3.408 ± 0.033 | 8.36 ± 0.045 |
1.928 ± 0.031 | 5.384 ± 0.033 |
2.6 ± 0.039 | 10.078 ± 0.055 |
Met |
Asn |
Gln |
Pro |
Arg |
Ser |
Thr |
Val |
Trp |
Tyr |
|---|---|---|---|---|---|---|---|---|---|
1.93 ± 0.023 | 2.686 ± 0.032 |
4.849 ± 0.035 | 2.904 ± 0.022 |
6.231 ± 0.057 | 6.66 ± 0.044 |
6.277 ± 0.078 | 8.662 ± 0.041 |
1.394 ± 0.018 | 2.054 ± 0.022 |
Most of the basic statistics you can see at this page can be downloaded from this CSV file
Proteome-pI is available under Creative Commons Attribution-NoDerivs license, for more details see here
| Reference: Kozlowski LP. Proteome-pI 2.0: Proteome Isoelectric Point Database Update. Nucleic Acids Res. 2021, doi: 10.1093/nar/gkab944 | Contact: Lukasz P. Kozlowski |
