Microbispora sp. ATCC PTA-5024
Taxonomy: cellular organisms; Bacteria; Terrabacteria group; Actinobacteria; Actinomycetia; Streptosporangiales; Streptosporangiaceae; Microbispora; unclassified Microbispora
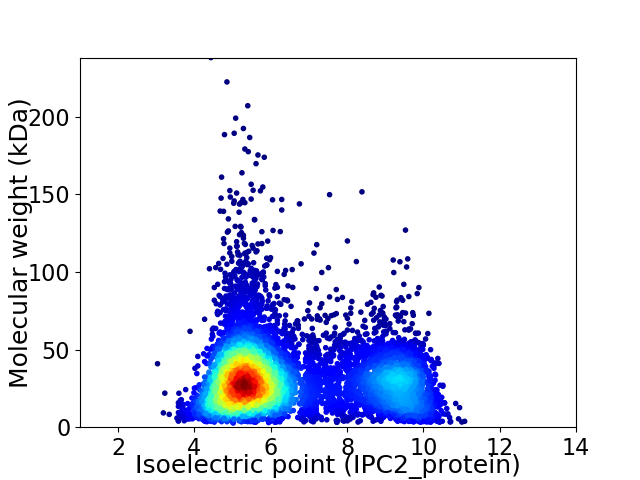
Average proteome isoelectric point is 6.45
Get precalculated fractions of proteins

Virtual 2D-PAGE plot for 7799 proteins (isoelectric point calculated using IPC2_protein)
Get csv file with sequences according to given criteria:
* You can choose from 21 different methods for calculating isoelectric point
Summary statistics related to proteome-wise predictions


Protein with the lowest isoelectric point:
>tr|W2EWE3|W2EWE3_9ACTN Uncharacterized protein OS=Microbispora sp. ATCC PTA-5024 OX=316330 GN=MPTA5024_15015 PE=4 SV=1
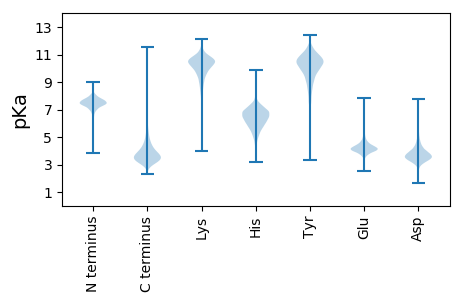
MM1 pKa = 8.78SMDD4 pKa = 3.6LHH6 pKa = 7.46DD7 pKa = 5.33GGHH10 pKa = 6.1TPADD14 pKa = 3.79DD15 pKa = 4.23PLADD19 pKa = 3.53VALDD23 pKa = 3.38ASGVHH28 pKa = 6.35LADD31 pKa = 5.79DD32 pKa = 4.97DD33 pKa = 4.44PPGPGVYY40 pKa = 10.45DD41 pKa = 3.95PDD43 pKa = 5.31GGTAGPYY50 pKa = 10.1GPEE53 pKa = 4.31GGLAGDD59 pKa = 4.46PAHH62 pKa = 7.04EE63 pKa = 3.76AAFWHH68 pKa = 6.02EE69 pKa = 3.98QAASDD74 pKa = 3.81TCAIAAQEE82 pKa = 4.08FVLDD86 pKa = 4.34DD87 pKa = 3.85LTGVPHH93 pKa = 6.72TEE95 pKa = 4.03AEE97 pKa = 4.21LTAVAEE103 pKa = 4.29EE104 pKa = 4.26NGWYY108 pKa = 10.08EE109 pKa = 4.29PGHH112 pKa = 5.49GTAMDD117 pKa = 3.92DD118 pKa = 3.29VGKK121 pKa = 10.54VLEE124 pKa = 4.66HH125 pKa = 6.37YY126 pKa = 9.01GVPVEE131 pKa = 4.45RR132 pKa = 11.84FGHH135 pKa = 5.23ATIADD140 pKa = 4.06LEE142 pKa = 4.4GALAGGRR149 pKa = 11.84DD150 pKa = 3.66VVAGVDD156 pKa = 3.54SGEE159 pKa = 3.68IWEE162 pKa = 4.47AQGLAQDD169 pKa = 4.01LDD171 pKa = 4.55GYY173 pKa = 10.15PGIPGQGADD182 pKa = 3.67HH183 pKa = 6.16VVQVTGVDD191 pKa = 3.41RR192 pKa = 11.84TDD194 pKa = 3.73PAHH197 pKa = 7.01PMVLMNDD204 pKa = 3.39SGSPSGAGAAVPLDD218 pKa = 3.65VFLDD222 pKa = 3.47AWGDD226 pKa = 3.52SGNFMIAAGGTRR238 pKa = 11.84GG239 pKa = 3.32
MM1 pKa = 8.78SMDD4 pKa = 3.6LHH6 pKa = 7.46DD7 pKa = 5.33GGHH10 pKa = 6.1TPADD14 pKa = 3.79DD15 pKa = 4.23PLADD19 pKa = 3.53VALDD23 pKa = 3.38ASGVHH28 pKa = 6.35LADD31 pKa = 5.79DD32 pKa = 4.97DD33 pKa = 4.44PPGPGVYY40 pKa = 10.45DD41 pKa = 3.95PDD43 pKa = 5.31GGTAGPYY50 pKa = 10.1GPEE53 pKa = 4.31GGLAGDD59 pKa = 4.46PAHH62 pKa = 7.04EE63 pKa = 3.76AAFWHH68 pKa = 6.02EE69 pKa = 3.98QAASDD74 pKa = 3.81TCAIAAQEE82 pKa = 4.08FVLDD86 pKa = 4.34DD87 pKa = 3.85LTGVPHH93 pKa = 6.72TEE95 pKa = 4.03AEE97 pKa = 4.21LTAVAEE103 pKa = 4.29EE104 pKa = 4.26NGWYY108 pKa = 10.08EE109 pKa = 4.29PGHH112 pKa = 5.49GTAMDD117 pKa = 3.92DD118 pKa = 3.29VGKK121 pKa = 10.54VLEE124 pKa = 4.66HH125 pKa = 6.37YY126 pKa = 9.01GVPVEE131 pKa = 4.45RR132 pKa = 11.84FGHH135 pKa = 5.23ATIADD140 pKa = 4.06LEE142 pKa = 4.4GALAGGRR149 pKa = 11.84DD150 pKa = 3.66VVAGVDD156 pKa = 3.54SGEE159 pKa = 3.68IWEE162 pKa = 4.47AQGLAQDD169 pKa = 4.01LDD171 pKa = 4.55GYY173 pKa = 10.15PGIPGQGADD182 pKa = 3.67HH183 pKa = 6.16VVQVTGVDD191 pKa = 3.41RR192 pKa = 11.84TDD194 pKa = 3.73PAHH197 pKa = 7.01PMVLMNDD204 pKa = 3.39SGSPSGAGAAVPLDD218 pKa = 3.65VFLDD222 pKa = 3.47AWGDD226 pKa = 3.52SGNFMIAAGGTRR238 pKa = 11.84GG239 pKa = 3.32
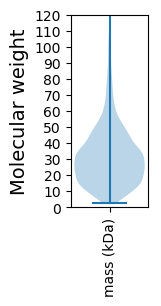
Molecular weight: 24.22 kDa
Isoelectric point according different methods:
Protein with the highest isoelectric point:
>tr|W2ESD7|W2ESD7_9ACTN Uncharacterized protein OS=Microbispora sp. ATCC PTA-5024 OX=316330 GN=MPTA5024_18670 PE=4 SV=1
MM1 pKa = 7.09IKK3 pKa = 10.12KK4 pKa = 9.49RR5 pKa = 11.84RR6 pKa = 11.84KK7 pKa = 9.21RR8 pKa = 11.84MAKK11 pKa = 9.41KK12 pKa = 9.99KK13 pKa = 9.77HH14 pKa = 5.81RR15 pKa = 11.84KK16 pKa = 8.55LLKK19 pKa = 8.44KK20 pKa = 9.17TRR22 pKa = 11.84IQRR25 pKa = 11.84RR26 pKa = 11.84NKK28 pKa = 9.73KK29 pKa = 9.84
MM1 pKa = 7.09IKK3 pKa = 10.12KK4 pKa = 9.49RR5 pKa = 11.84RR6 pKa = 11.84KK7 pKa = 9.21RR8 pKa = 11.84MAKK11 pKa = 9.41KK12 pKa = 9.99KK13 pKa = 9.77HH14 pKa = 5.81RR15 pKa = 11.84KK16 pKa = 8.55LLKK19 pKa = 8.44KK20 pKa = 9.17TRR22 pKa = 11.84IQRR25 pKa = 11.84RR26 pKa = 11.84NKK28 pKa = 9.73KK29 pKa = 9.84
Molecular weight: 3.79 kDa
Isoelectric point according different methods:
Peptides (in silico digests for buttom-up proteomics)
Below you can find in silico digests of the whole proteome with Trypsin, Chymotrypsin, Trypsin+LysC, LysN, ArgC proteases suitable for different mass spec machines.| Try ESI |
 |
|---|
| ChTry ESI |
 |
|---|
| ArgC ESI |
 |
|---|
| LysN ESI |
 |
|---|
| TryLysC ESI |
 |
|---|
| Try MALDI |
 |
|---|
| ChTry MALDI |
 |
|---|
| ArgC MALDI |
 |
|---|
| LysN MALDI |
 |
|---|
| TryLysC MALDI |
 |
|---|
| Try LTQ |
 |
|---|
| ChTry LTQ |
 |
|---|
| ArgC LTQ |
 |
|---|
| LysN LTQ |
 |
|---|
| TryLysC LTQ |
 |
|---|
| Try MSlow |
 |
|---|
| ChTry MSlow |
 |
|---|
| ArgC MSlow |
 |
|---|
| LysN MSlow |
 |
|---|
| TryLysC MSlow |
 |
|---|
| Try MShigh |
 |
|---|
| ChTry MShigh |
 |
|---|
| ArgC MShigh |
 |
|---|
| LysN MShigh |
 |
|---|
| TryLysC MShigh |
 |
|---|
General Statistics
Number of major isoforms |
Number of additional isoforms |
Number of all proteins |
Number of amino acids |
Min. Seq. Length |
Max. Seq. Length |
Avg. Seq. Length |
Avg. Mol. Weight |
|---|---|---|---|---|---|---|---|
0 |
2428602 |
29 |
2240 |
311.4 |
33.32 |
Amino acid frequency
Ala |
Cys |
Asp |
Glu |
Phe |
Gly |
His |
Ile |
Lys |
Leu |
|---|---|---|---|---|---|---|---|---|---|
13.708 ± 0.043 | 0.771 ± 0.008 |
5.913 ± 0.023 | 5.523 ± 0.029 |
2.795 ± 0.015 | 9.69 ± 0.032 |
2.139 ± 0.014 | 3.3 ± 0.018 |
1.757 ± 0.02 | 10.435 ± 0.032 |
Met |
Asn |
Gln |
Pro |
Arg |
Ser |
Thr |
Val |
Trp |
Tyr |
|---|---|---|---|---|---|---|---|---|---|
1.823 ± 0.011 | 1.705 ± 0.017 |
6.201 ± 0.027 | 2.489 ± 0.016 |
8.45 ± 0.036 | 4.936 ± 0.02 |
5.693 ± 0.026 | 8.968 ± 0.027 |
1.573 ± 0.012 | 2.13 ± 0.014 |
Most of the basic statistics you can see at this page can be downloaded from this CSV file
Proteome-pI is available under Creative Commons Attribution-NoDerivs license, for more details see here
| Reference: Kozlowski LP. Proteome-pI 2.0: Proteome Isoelectric Point Database Update. Nucleic Acids Res. 2021, doi: 10.1093/nar/gkab944 | Contact: Lukasz P. Kozlowski |
