Clostridium sp. N3C
Taxonomy: cellular organisms; Bacteria; Terrabacteria group; Firmicutes; Clostridia; Eubacteriales; Clostridiaceae; Clostridium; unclassified Clostridium
Average proteome isoelectric point is 6.48
Get precalculated fractions of proteins

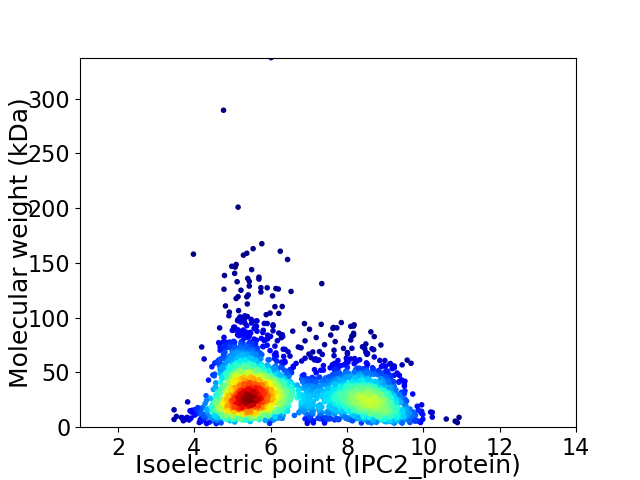
Virtual 2D-PAGE plot for 2848 proteins (isoelectric point calculated using IPC2_protein)
Get csv file with sequences according to given criteria:
* You can choose from 21 different methods for calculating isoelectric point
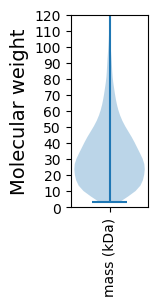
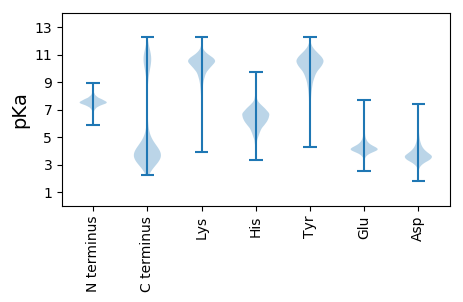
Summary statistics related to proteome-wise predictions


Protein with the lowest isoelectric point:
>tr|A0A1M4NDA7|A0A1M4NDA7_9CLOT Membrane dipeptidase (Peptidase family M19) OS=Clostridium sp. N3C OX=1776758 GN=N3C_2222 PE=4 SV=1
MM1 pKa = 7.69AAQNYY6 pKa = 9.28YY7 pKa = 11.04LLTLMSVTPLASDD20 pKa = 4.34PSNKK24 pKa = 9.34IQTVEE29 pKa = 4.17YY30 pKa = 9.97NVKK33 pKa = 8.94LTSDD37 pKa = 3.48NSNVTDD43 pKa = 3.86LAKK46 pKa = 11.08ANFILSSNTSIDD58 pKa = 3.64PADD61 pKa = 3.61WTLDD65 pKa = 3.28TTDD68 pKa = 4.29ASNGNYY74 pKa = 9.99SVTFEE79 pKa = 4.57SGAEE83 pKa = 3.87LDD85 pKa = 3.76VTSYY89 pKa = 11.1LVAYY93 pKa = 9.88VEE95 pKa = 4.32NTGNKK100 pKa = 9.01SDD102 pKa = 3.75KK103 pKa = 10.91LFVDD107 pKa = 5.32FSQALDD113 pKa = 3.64AQGSATYY120 pKa = 9.59SYY122 pKa = 11.43NVSTPGKK129 pKa = 9.3YY130 pKa = 9.94YY131 pKa = 10.63FVLDD135 pKa = 3.78SADD138 pKa = 3.21GVVLNKK144 pKa = 10.16EE145 pKa = 4.15SAEE148 pKa = 4.12SYY150 pKa = 11.03DD151 pKa = 3.98FNNPPDD157 pKa = 4.48PNNSSIAVTFAKK169 pKa = 10.2PYY171 pKa = 9.25LAQIIPDD178 pKa = 4.02PVTGLNVNVIVTLKK192 pKa = 10.69DD193 pKa = 3.54VNDD196 pKa = 3.85TPLIGNNEE204 pKa = 3.73VSFYY208 pKa = 11.56ARR210 pKa = 11.84LEE212 pKa = 4.18SS213 pKa = 3.63
MM1 pKa = 7.69AAQNYY6 pKa = 9.28YY7 pKa = 11.04LLTLMSVTPLASDD20 pKa = 4.34PSNKK24 pKa = 9.34IQTVEE29 pKa = 4.17YY30 pKa = 9.97NVKK33 pKa = 8.94LTSDD37 pKa = 3.48NSNVTDD43 pKa = 3.86LAKK46 pKa = 11.08ANFILSSNTSIDD58 pKa = 3.64PADD61 pKa = 3.61WTLDD65 pKa = 3.28TTDD68 pKa = 4.29ASNGNYY74 pKa = 9.99SVTFEE79 pKa = 4.57SGAEE83 pKa = 3.87LDD85 pKa = 3.76VTSYY89 pKa = 11.1LVAYY93 pKa = 9.88VEE95 pKa = 4.32NTGNKK100 pKa = 9.01SDD102 pKa = 3.75KK103 pKa = 10.91LFVDD107 pKa = 5.32FSQALDD113 pKa = 3.64AQGSATYY120 pKa = 9.59SYY122 pKa = 11.43NVSTPGKK129 pKa = 9.3YY130 pKa = 9.94YY131 pKa = 10.63FVLDD135 pKa = 3.78SADD138 pKa = 3.21GVVLNKK144 pKa = 10.16EE145 pKa = 4.15SAEE148 pKa = 4.12SYY150 pKa = 11.03DD151 pKa = 3.98FNNPPDD157 pKa = 4.48PNNSSIAVTFAKK169 pKa = 10.2PYY171 pKa = 9.25LAQIIPDD178 pKa = 4.02PVTGLNVNVIVTLKK192 pKa = 10.69DD193 pKa = 3.54VNDD196 pKa = 3.85TPLIGNNEE204 pKa = 3.73VSFYY208 pKa = 11.56ARR210 pKa = 11.84LEE212 pKa = 4.18SS213 pKa = 3.63
Molecular weight: 23.08 kDa
Isoelectric point according different methods:
Protein with the highest isoelectric point:
>tr|A0A1M4NC77|A0A1M4NC77_9CLOT DNA polymerase III subunit gamma/tau OS=Clostridium sp. N3C OX=1776758 GN=dnaX PE=3 SV=1
MM1 pKa = 7.29ARR3 pKa = 11.84KK4 pKa = 9.71AIIEE8 pKa = 4.08KK9 pKa = 9.11WKK11 pKa = 10.78KK12 pKa = 7.55EE13 pKa = 3.85PKK15 pKa = 8.7YY16 pKa = 8.29QTRR19 pKa = 11.84AYY21 pKa = 7.9TRR23 pKa = 11.84CRR25 pKa = 11.84ICGRR29 pKa = 11.84PHH31 pKa = 6.44AVLRR35 pKa = 11.84KK36 pKa = 9.63YY37 pKa = 9.83GICRR41 pKa = 11.84ICFRR45 pKa = 11.84EE46 pKa = 3.97LAYY49 pKa = 9.88KK50 pKa = 10.14GQIPGCRR57 pKa = 11.84KK58 pKa = 10.14ASWW61 pKa = 3.01
MM1 pKa = 7.29ARR3 pKa = 11.84KK4 pKa = 9.71AIIEE8 pKa = 4.08KK9 pKa = 9.11WKK11 pKa = 10.78KK12 pKa = 7.55EE13 pKa = 3.85PKK15 pKa = 8.7YY16 pKa = 8.29QTRR19 pKa = 11.84AYY21 pKa = 7.9TRR23 pKa = 11.84CRR25 pKa = 11.84ICGRR29 pKa = 11.84PHH31 pKa = 6.44AVLRR35 pKa = 11.84KK36 pKa = 9.63YY37 pKa = 9.83GICRR41 pKa = 11.84ICFRR45 pKa = 11.84EE46 pKa = 3.97LAYY49 pKa = 9.88KK50 pKa = 10.14GQIPGCRR57 pKa = 11.84KK58 pKa = 10.14ASWW61 pKa = 3.01
Molecular weight: 7.29 kDa
Isoelectric point according different methods:
Peptides (in silico digests for buttom-up proteomics)
Below you can find in silico digests of the whole proteome with Trypsin, Chymotrypsin, Trypsin+LysC, LysN, ArgC proteases suitable for different mass spec machines.| Try ESI |
 |
|---|
| ChTry ESI |
 |
|---|
| ArgC ESI |
 |
|---|
| LysN ESI |
 |
|---|
| TryLysC ESI |
 |
|---|
| Try MALDI |
 |
|---|
| ChTry MALDI |
 |
|---|
| ArgC MALDI |
 |
|---|
| LysN MALDI |
 |
|---|
| TryLysC MALDI |
 |
|---|
| Try LTQ |
 |
|---|
| ChTry LTQ |
 |
|---|
| ArgC LTQ |
 |
|---|
| LysN LTQ |
 |
|---|
| TryLysC LTQ |
 |
|---|
| Try MSlow |
 |
|---|
| ChTry MSlow |
 |
|---|
| ArgC MSlow |
 |
|---|
| LysN MSlow |
 |
|---|
| TryLysC MSlow |
 |
|---|
| Try MShigh |
 |
|---|
| ChTry MShigh |
 |
|---|
| ArgC MShigh |
 |
|---|
| LysN MShigh |
 |
|---|
| TryLysC MShigh |
 |
|---|
General Statistics
Number of major isoforms |
Number of additional isoforms |
Number of all proteins |
Number of amino acids |
Min. Seq. Length |
Max. Seq. Length |
Avg. Seq. Length |
Avg. Mol. Weight |
|---|---|---|---|---|---|---|---|
0 |
868247 |
29 |
2934 |
304.9 |
34.45 |
Amino acid frequency
Ala |
Cys |
Asp |
Glu |
Phe |
Gly |
His |
Ile |
Lys |
Leu |
|---|---|---|---|---|---|---|---|---|---|
6.039 ± 0.047 | 1.135 ± 0.018 |
5.537 ± 0.03 | 7.622 ± 0.051 |
4.238 ± 0.035 | 6.267 ± 0.038 |
1.44 ± 0.017 | 9.529 ± 0.056 |
8.769 ± 0.037 | 9.238 ± 0.052 |
Met |
Asn |
Gln |
Pro |
Arg |
Ser |
Thr |
Val |
Trp |
Tyr |
|---|---|---|---|---|---|---|---|---|---|
2.579 ± 0.02 | 5.815 ± 0.041 |
2.867 ± 0.026 | 2.563 ± 0.022 |
3.665 ± 0.034 | 6.332 ± 0.041 |
4.769 ± 0.036 | 6.595 ± 0.041 |
0.701 ± 0.015 | 4.3 ± 0.031 |
Most of the basic statistics you can see at this page can be downloaded from this CSV file
Proteome-pI is available under Creative Commons Attribution-NoDerivs license, for more details see here
| Reference: Kozlowski LP. Proteome-pI 2.0: Proteome Isoelectric Point Database Update. Nucleic Acids Res. 2021, doi: 10.1093/nar/gkab944 | Contact: Lukasz P. Kozlowski |
