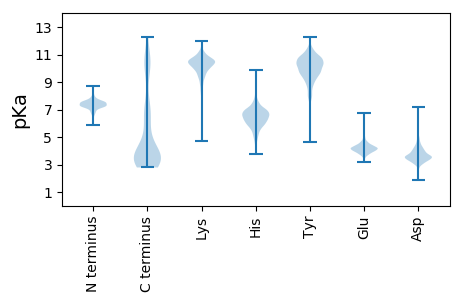
Spodoptera litura (Asian cotton leafworm)
Taxonomy: cellular organisms; Eukaryota; Opisthokonta; Metazoa; Eumetazoa; Bilateria; Protostomia; Ecdysozoa; Panarthropoda; Arthropoda; Mandibulata; Pancrustacea; Hexapoda; Insecta; Dicondylia; Pterygota; Neoptera; Endopterygota; Amphiesmenoptera; Lepidoptera; Glossata; Neolepidoptera; Heteroneura; Ditrysia;
Average proteome isoelectric point is 6.37
Get precalculated fractions of proteins

Virtual 2D-PAGE plot for 283 proteins (isoelectric point calculated using IPC2_protein)
Get csv file with sequences according to given criteria:
* You can choose from 21 different methods for calculating isoelectric point
Summary statistics related to proteome-wise predictions


Protein with the lowest isoelectric point:
>tr|A0A4U7BG86|A0A4U7BG86_SPOLT Cuticular protein CPAP3-A1 OS=Spodoptera litura OX=69820 GN=BJG85_SLAki020 PE=4 SV=1
MM1 pKa = 7.58KK2 pKa = 10.58SFIVLALFVAAAVAAPASPDD22 pKa = 2.95ADD24 pKa = 3.34AVVVRR29 pKa = 11.84YY30 pKa = 10.17DD31 pKa = 3.31SDD33 pKa = 4.15NIGVDD38 pKa = 3.95GYY40 pKa = 11.1NYY42 pKa = 10.75AVEE45 pKa = 4.22TSNGIAAQEE54 pKa = 3.79QGQLKK59 pKa = 10.27NAGTEE64 pKa = 3.9NEE66 pKa = 4.25AIEE69 pKa = 4.21VRR71 pKa = 11.84GQFSYY76 pKa = 10.22TGPDD80 pKa = 3.04GVVYY84 pKa = 9.37TVTYY88 pKa = 9.49IANEE92 pKa = 3.97QGFQPQGAHH101 pKa = 6.72IPQAPP106 pKa = 3.19
MM1 pKa = 7.58KK2 pKa = 10.58SFIVLALFVAAAVAAPASPDD22 pKa = 2.95ADD24 pKa = 3.34AVVVRR29 pKa = 11.84YY30 pKa = 10.17DD31 pKa = 3.31SDD33 pKa = 4.15NIGVDD38 pKa = 3.95GYY40 pKa = 11.1NYY42 pKa = 10.75AVEE45 pKa = 4.22TSNGIAAQEE54 pKa = 3.79QGQLKK59 pKa = 10.27NAGTEE64 pKa = 3.9NEE66 pKa = 4.25AIEE69 pKa = 4.21VRR71 pKa = 11.84GQFSYY76 pKa = 10.22TGPDD80 pKa = 3.04GVVYY84 pKa = 9.37TVTYY88 pKa = 9.49IANEE92 pKa = 3.97QGFQPQGAHH101 pKa = 6.72IPQAPP106 pKa = 3.19
Molecular weight: 11.11 kDa
Isoelectric point according different methods:
Protein with the highest isoelectric point:
>tr|A0A4V6DVF6|A0A4V6DVF6_SPOLT Cuticular protein CPG OS=Spodoptera litura OX=69820 GN=BJG85_SLAki221 PE=4 SV=1
MM1 pKa = 7.33SRR3 pKa = 11.84LTIFFVIAVAYY14 pKa = 8.9EE15 pKa = 4.03VIADD19 pKa = 3.99DD20 pKa = 5.2SRR22 pKa = 11.84AEE24 pKa = 3.75QSGFISPVIAAGNLGLAGAAIAGGPGIIGGPAVVAAGPAIVGAGPAVVASGPAVVAGGPVIGSGAALNNAAAVGAAQLSAIQNAQAVQAAQIANSAAAAIQEE126 pKa = 4.05ARR128 pKa = 11.84ATEE131 pKa = 3.84AAARR135 pKa = 11.84AGQAQAMNNAAALNAARR152 pKa = 11.84VANIQRR158 pKa = 11.84AQAAAWEE165 pKa = 4.23NARR168 pKa = 11.84ATEE171 pKa = 3.84AARR174 pKa = 11.84RR175 pKa = 11.84AGAGAALEE183 pKa = 4.04AARR186 pKa = 11.84AAEE189 pKa = 4.12AARR192 pKa = 11.84VADD195 pKa = 4.07AARR198 pKa = 11.84LQAIAIANTRR208 pKa = 11.84NVEE211 pKa = 3.85AARR214 pKa = 11.84IANAARR220 pKa = 11.84AQAAAVANSAAQAQAVADD238 pKa = 4.29TVARR242 pKa = 11.84TAHH245 pKa = 6.91DD246 pKa = 3.86GALLLGGGGALVGGGAVLAGPAVAVGGLGGYY277 pKa = 10.02GLGGAGKK284 pKa = 9.91LIHH287 pKa = 6.59HH288 pKa = 7.47
MM1 pKa = 7.33SRR3 pKa = 11.84LTIFFVIAVAYY14 pKa = 8.9EE15 pKa = 4.03VIADD19 pKa = 3.99DD20 pKa = 5.2SRR22 pKa = 11.84AEE24 pKa = 3.75QSGFISPVIAAGNLGLAGAAIAGGPGIIGGPAVVAAGPAIVGAGPAVVASGPAVVAGGPVIGSGAALNNAAAVGAAQLSAIQNAQAVQAAQIANSAAAAIQEE126 pKa = 4.05ARR128 pKa = 11.84ATEE131 pKa = 3.84AAARR135 pKa = 11.84AGQAQAMNNAAALNAARR152 pKa = 11.84VANIQRR158 pKa = 11.84AQAAAWEE165 pKa = 4.23NARR168 pKa = 11.84ATEE171 pKa = 3.84AARR174 pKa = 11.84RR175 pKa = 11.84AGAGAALEE183 pKa = 4.04AARR186 pKa = 11.84AAEE189 pKa = 4.12AARR192 pKa = 11.84VADD195 pKa = 4.07AARR198 pKa = 11.84LQAIAIANTRR208 pKa = 11.84NVEE211 pKa = 3.85AARR214 pKa = 11.84IANAARR220 pKa = 11.84AQAAAVANSAAQAQAVADD238 pKa = 4.29TVARR242 pKa = 11.84TAHH245 pKa = 6.91DD246 pKa = 3.86GALLLGGGGALVGGGAVLAGPAVAVGGLGGYY277 pKa = 10.02GLGGAGKK284 pKa = 9.91LIHH287 pKa = 6.59HH288 pKa = 7.47
Molecular weight: 27.06 kDa
Isoelectric point according different methods:
Peptides (in silico digests for buttom-up proteomics)
Below you can find in silico digests of the whole proteome with Trypsin, Chymotrypsin, Trypsin+LysC, LysN, ArgC proteases suitable for different mass spec machines.| Try ESI |
 |
|---|
| ChTry ESI |
 |
|---|
| ArgC ESI |
 |
|---|
| LysN ESI |
 |
|---|
| TryLysC ESI |
 |
|---|
| Try MALDI |
 |
|---|
| ChTry MALDI |
 |
|---|
| ArgC MALDI |
 |
|---|
| LysN MALDI |
 |
|---|
| TryLysC MALDI |
 |
|---|
| Try LTQ |
 |
|---|
| ChTry LTQ |
 |
|---|
| ArgC LTQ |
 |
|---|
| LysN LTQ |
 |
|---|
| TryLysC LTQ |
 |
|---|
| Try MSlow |
 |
|---|
| ChTry MSlow |
 |
|---|
| ArgC MSlow |
 |
|---|
| LysN MSlow |
 |
|---|
| TryLysC MSlow |
 |
|---|
| Try MShigh |
 |
|---|
| ChTry MShigh |
 |
|---|
| ArgC MShigh |
 |
|---|
| LysN MShigh |
 |
|---|
| TryLysC MShigh |
 |
|---|
General Statistics
Number of major isoforms |
Number of additional isoforms |
Number of all proteins |
Number of amino acids |
Min. Seq. Length |
Max. Seq. Length |
Avg. Seq. Length |
Avg. Mol. Weight |
|---|---|---|---|---|---|---|---|
0 |
62312 |
68 |
1312 |
220.2 |
23.77 |
Amino acid frequency
Ala |
Cys |
Asp |
Glu |
Phe |
Gly |
His |
Ile |
Lys |
Leu |
|---|---|---|---|---|---|---|---|---|---|
12.193 ± 0.565 | 0.741 ± 0.103 |
4.68 ± 0.175 | 4.917 ± 0.195 |
2.688 ± 0.091 | 8.059 ± 0.491 |
5.265 ± 0.405 | 3.731 ± 0.14 |
4.701 ± 0.188 | 4.84 ± 0.161 |
Met |
Asn |
Gln |
Pro |
Arg |
Ser |
Thr |
Val |
Trp |
Tyr |
|---|---|---|---|---|---|---|---|---|---|
0.875 ± 0.063 | 3.593 ± 0.245 |
8.379 ± 0.293 | 4.585 ± 0.197 |
3.37 ± 0.219 | 7.514 ± 0.267 |
4.383 ± 0.303 | 8.843 ± 0.323 |
0.406 ± 0.049 | 6.236 ± 0.183 |
Most of the basic statistics you can see at this page can be downloaded from this CSV file
Proteome-pI is available under Creative Commons Attribution-NoDerivs license, for more details see here
| Reference: Kozlowski LP. Proteome-pI 2.0: Proteome Isoelectric Point Database Update. Nucleic Acids Res. 2021, doi: 10.1093/nar/gkab944 | Contact: Lukasz P. Kozlowski |
