Vulcanisaeta sp. SCGC AB-777_J10
Taxonomy: cellular organisms; Archaea; TACK group; Crenarchaeota; Thermoprotei; Thermoproteales; Thermoproteaceae; Vulcanisaeta; unclassified Vulcanisaeta
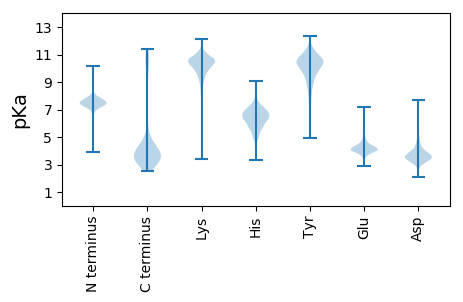
Average proteome isoelectric point is 6.8
Get precalculated fractions of proteins

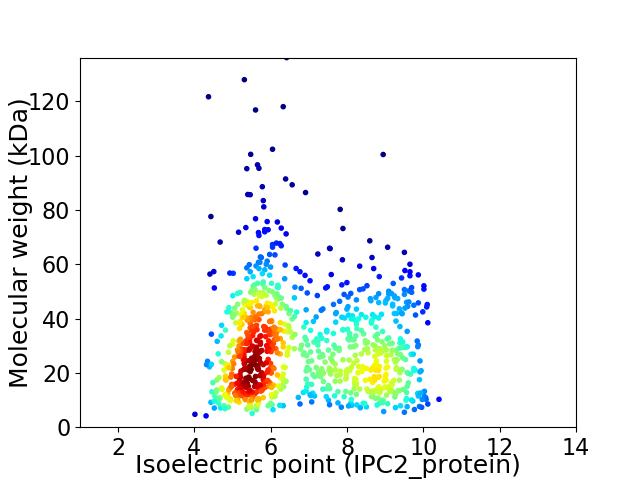
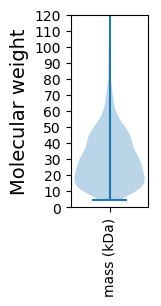
Virtual 2D-PAGE plot for 918 proteins (isoelectric point calculated using IPC2_protein)
Get csv file with sequences according to given criteria:
* You can choose from 21 different methods for calculating isoelectric point
Summary statistics related to proteome-wise predictions


Protein with the lowest isoelectric point:
>tr|A0A2T9WWQ0|A0A2T9WWQ0_9CREN Uncharacterized protein OS=Vulcanisaeta sp. SCGC AB-777_J10 OX=1987493 GN=DDW08_02560 PE=4 SV=1
MM1 pKa = 7.36STPQTQWIILSMVFLVLAAVFGTLWFITNQNYY33 pKa = 6.81TTLLASYY40 pKa = 7.77NTLKK44 pKa = 10.8AQYY47 pKa = 10.82DD48 pKa = 3.85NLQTQCNTLQAEE60 pKa = 4.53LNNLQSQYY68 pKa = 11.17SSCEE72 pKa = 3.83TQLNNLQAQNTQLKK86 pKa = 9.98QEE88 pKa = 4.14LQGCGLTTTLQVQAVGLTGVSSGSSANLTLLISNPSSSGIGLNGFTLGSLSCVFSSPVQVPAGTQGGEE156 pKa = 3.96LVIRR160 pKa = 11.84LAMSNGAFDD169 pKa = 4.33GVSDD173 pKa = 4.0IYY175 pKa = 11.4GNGIIVPGGIAASCSGSQTAAVGIQYY201 pKa = 10.22SGYY204 pKa = 7.41ITTVSGQTYY213 pKa = 8.92PFTVTASSS221 pKa = 3.2
MM1 pKa = 7.36STPQTQWIILSMVFLVLAAVFGTLWFITNQNYY33 pKa = 6.81TTLLASYY40 pKa = 7.77NTLKK44 pKa = 10.8AQYY47 pKa = 10.82DD48 pKa = 3.85NLQTQCNTLQAEE60 pKa = 4.53LNNLQSQYY68 pKa = 11.17SSCEE72 pKa = 3.83TQLNNLQAQNTQLKK86 pKa = 9.98QEE88 pKa = 4.14LQGCGLTTTLQVQAVGLTGVSSGSSANLTLLISNPSSSGIGLNGFTLGSLSCVFSSPVQVPAGTQGGEE156 pKa = 3.96LVIRR160 pKa = 11.84LAMSNGAFDD169 pKa = 4.33GVSDD173 pKa = 4.0IYY175 pKa = 11.4GNGIIVPGGIAASCSGSQTAAVGIQYY201 pKa = 10.22SGYY204 pKa = 7.41ITTVSGQTYY213 pKa = 8.92PFTVTASSS221 pKa = 3.2
Molecular weight: 23.04 kDa
Isoelectric point according different methods:
Protein with the highest isoelectric point:
>tr|A0A2T9WU59|A0A2T9WU59_9CREN Uncharacterized protein OS=Vulcanisaeta sp. SCGC AB-777_J10 OX=1987493 GN=DDW08_04020 PE=4 SV=1
MM1 pKa = 6.9TAYY4 pKa = 10.49ALRR7 pKa = 11.84RR8 pKa = 11.84PDD10 pKa = 3.15VSGTFLEE17 pKa = 4.25RR18 pKa = 11.84LNRR21 pKa = 11.84FVGIAEE27 pKa = 4.09INGEE31 pKa = 4.03RR32 pKa = 11.84VRR34 pKa = 11.84VHH36 pKa = 5.27IHH38 pKa = 5.99DD39 pKa = 4.52PGRR42 pKa = 11.84LRR44 pKa = 11.84EE45 pKa = 4.03LLRR48 pKa = 11.84PGVRR52 pKa = 11.84IHH54 pKa = 7.49AYY56 pKa = 9.97NKK58 pKa = 9.35VGGKK62 pKa = 6.55TRR64 pKa = 11.84YY65 pKa = 9.69YY66 pKa = 10.72LVAVDD71 pKa = 5.61LGDD74 pKa = 3.68EE75 pKa = 4.18LVLVNSAIHH84 pKa = 6.15NDD86 pKa = 2.69IVAWLVSNGIVLRR99 pKa = 11.84RR100 pKa = 11.84YY101 pKa = 8.54QVVRR105 pKa = 11.84RR106 pKa = 11.84EE107 pKa = 4.05PVFGSGRR114 pKa = 11.84FDD116 pKa = 3.83LLLRR120 pKa = 11.84SPSGKK125 pKa = 9.29EE126 pKa = 3.22AFMEE130 pKa = 4.52VKK132 pKa = 10.48GVTLVDD138 pKa = 3.19NGVAKK143 pKa = 10.66FPDD146 pKa = 4.45PYY148 pKa = 10.67GQASFLQGRR157 pKa = 11.84GKK159 pKa = 10.4VFKK162 pKa = 10.74LLFATSVVCLLLNRR176 pKa = 11.84LGLGRR181 pKa = 11.84ILRR184 pKa = 11.84RR185 pKa = 11.84SS186 pKa = 3.27
MM1 pKa = 6.9TAYY4 pKa = 10.49ALRR7 pKa = 11.84RR8 pKa = 11.84PDD10 pKa = 3.15VSGTFLEE17 pKa = 4.25RR18 pKa = 11.84LNRR21 pKa = 11.84FVGIAEE27 pKa = 4.09INGEE31 pKa = 4.03RR32 pKa = 11.84VRR34 pKa = 11.84VHH36 pKa = 5.27IHH38 pKa = 5.99DD39 pKa = 4.52PGRR42 pKa = 11.84LRR44 pKa = 11.84EE45 pKa = 4.03LLRR48 pKa = 11.84PGVRR52 pKa = 11.84IHH54 pKa = 7.49AYY56 pKa = 9.97NKK58 pKa = 9.35VGGKK62 pKa = 6.55TRR64 pKa = 11.84YY65 pKa = 9.69YY66 pKa = 10.72LVAVDD71 pKa = 5.61LGDD74 pKa = 3.68EE75 pKa = 4.18LVLVNSAIHH84 pKa = 6.15NDD86 pKa = 2.69IVAWLVSNGIVLRR99 pKa = 11.84RR100 pKa = 11.84YY101 pKa = 8.54QVVRR105 pKa = 11.84RR106 pKa = 11.84EE107 pKa = 4.05PVFGSGRR114 pKa = 11.84FDD116 pKa = 3.83LLLRR120 pKa = 11.84SPSGKK125 pKa = 9.29EE126 pKa = 3.22AFMEE130 pKa = 4.52VKK132 pKa = 10.48GVTLVDD138 pKa = 3.19NGVAKK143 pKa = 10.66FPDD146 pKa = 4.45PYY148 pKa = 10.67GQASFLQGRR157 pKa = 11.84GKK159 pKa = 10.4VFKK162 pKa = 10.74LLFATSVVCLLLNRR176 pKa = 11.84LGLGRR181 pKa = 11.84ILRR184 pKa = 11.84RR185 pKa = 11.84SS186 pKa = 3.27
Molecular weight: 20.86 kDa
Isoelectric point according different methods:
Peptides (in silico digests for buttom-up proteomics)
Below you can find in silico digests of the whole proteome with Trypsin, Chymotrypsin, Trypsin+LysC, LysN, ArgC proteases suitable for different mass spec machines.| Try ESI |
 |
|---|
| ChTry ESI |
 |
|---|
| ArgC ESI |
 |
|---|
| LysN ESI |
 |
|---|
| TryLysC ESI |
 |
|---|
| Try MALDI |
 |
|---|
| ChTry MALDI |
 |
|---|
| ArgC MALDI |
 |
|---|
| LysN MALDI |
 |
|---|
| TryLysC MALDI |
 |
|---|
| Try LTQ |
 |
|---|
| ChTry LTQ |
 |
|---|
| ArgC LTQ |
 |
|---|
| LysN LTQ |
 |
|---|
| TryLysC LTQ |
 |
|---|
| Try MSlow |
 |
|---|
| ChTry MSlow |
 |
|---|
| ArgC MSlow |
 |
|---|
| LysN MSlow |
 |
|---|
| TryLysC MSlow |
 |
|---|
| Try MShigh |
 |
|---|
| ChTry MShigh |
 |
|---|
| ArgC MShigh |
 |
|---|
| LysN MShigh |
 |
|---|
| TryLysC MShigh |
 |
|---|
General Statistics
Number of major isoforms |
Number of additional isoforms |
Number of all proteins |
Number of amino acids |
Min. Seq. Length |
Max. Seq. Length |
Avg. Seq. Length |
Avg. Mol. Weight |
|---|---|---|---|---|---|---|---|
0 |
254953 |
35 |
1192 |
277.7 |
31.11 |
Amino acid frequency
Ala |
Cys |
Asp |
Glu |
Phe |
Gly |
His |
Ile |
Lys |
Leu |
|---|---|---|---|---|---|---|---|---|---|
7.016 ± 0.084 | 0.733 ± 0.034 |
4.987 ± 0.071 | 6.322 ± 0.091 |
3.468 ± 0.052 | 7.549 ± 0.073 |
1.489 ± 0.032 | 8.081 ± 0.08 |
4.91 ± 0.086 | 10.454 ± 0.103 |
Met |
Asn |
Gln |
Pro |
Arg |
Ser |
Thr |
Val |
Trp |
Tyr |
|---|---|---|---|---|---|---|---|---|---|
2.582 ± 0.036 | 4.145 ± 0.07 |
4.478 ± 0.068 | 1.879 ± 0.041 |
6.545 ± 0.097 | 5.771 ± 0.074 |
4.895 ± 0.085 | 8.986 ± 0.074 |
1.285 ± 0.037 | 4.424 ± 0.075 |
Most of the basic statistics you can see at this page can be downloaded from this CSV file
Proteome-pI is available under Creative Commons Attribution-NoDerivs license, for more details see here
| Reference: Kozlowski LP. Proteome-pI 2.0: Proteome Isoelectric Point Database Update. Nucleic Acids Res. 2021, doi: 10.1093/nar/gkab944 | Contact: Lukasz P. Kozlowski |
