Hymenobacter crusticola
Taxonomy: cellular organisms; Bacteria; FCB group; Bacteroidetes/Chlorobi group; Bacteroidetes; Cytophagia; Cytophagales; Hymenobacteraceae; Hymenobacter
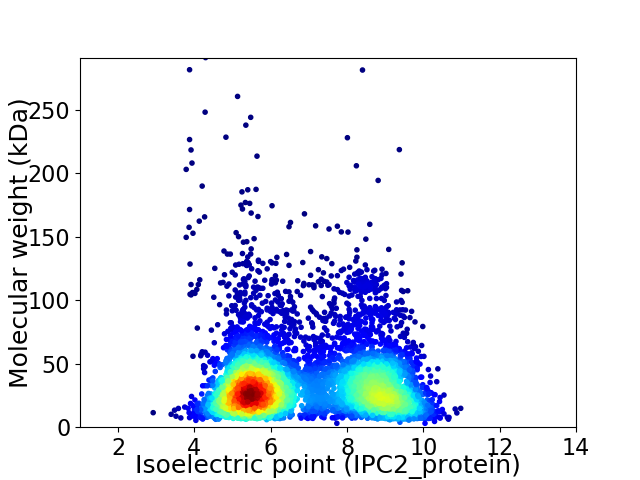
Average proteome isoelectric point is 6.86
Get precalculated fractions of proteins

Virtual 2D-PAGE plot for 5735 proteins (isoelectric point calculated using IPC2_protein)
Get csv file with sequences according to given criteria:
* You can choose from 21 different methods for calculating isoelectric point
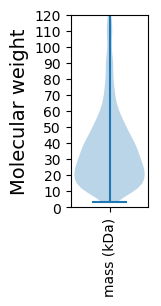
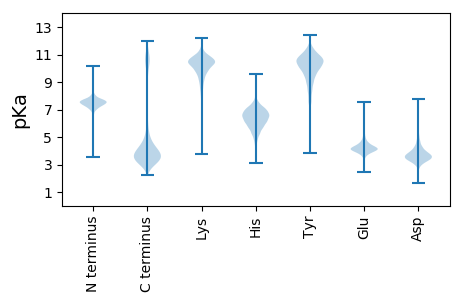
Summary statistics related to proteome-wise predictions


Protein with the lowest isoelectric point:
>tr|A0A243WC56|A0A243WC56_9BACT Aspartate kinase OS=Hymenobacter crusticola OX=1770526 GN=BXP70_15450 PE=4 SV=1
MM1 pKa = 7.78LSTLTYY7 pKa = 9.16TALPSQEE14 pKa = 4.14KK15 pKa = 10.15LQAICKK21 pKa = 9.65AVAVLDD27 pKa = 4.05ALNSPEE33 pKa = 3.95YY34 pKa = 9.84EE35 pKa = 3.94YY36 pKa = 10.73RR37 pKa = 11.84YY38 pKa = 10.45YY39 pKa = 11.01SYY41 pKa = 11.72NKK43 pKa = 8.7GWAEE47 pKa = 3.88GEE49 pKa = 4.53EE50 pKa = 4.26VFEE53 pKa = 4.28MQDD56 pKa = 3.46GEE58 pKa = 4.48GDD60 pKa = 3.23QMLILFRR67 pKa = 11.84AEE69 pKa = 3.71GCVINGYY76 pKa = 10.61ASDD79 pKa = 4.11YY80 pKa = 11.21EE81 pKa = 4.26EE82 pKa = 4.45SDD84 pKa = 3.4KK85 pKa = 11.72NQLTRR90 pKa = 11.84GLPDD94 pKa = 3.2VFDD97 pKa = 3.76EE98 pKa = 5.65FIFGEE103 pKa = 4.39PVNSIGTTFCLWYY116 pKa = 9.44TPAHH120 pKa = 6.54KK121 pKa = 9.62WQIGQLEE128 pKa = 4.18TDD130 pKa = 3.51EE131 pKa = 5.61DD132 pKa = 4.32GSEE135 pKa = 3.98NFLDD139 pKa = 3.82IFDD142 pKa = 5.19GNPHH146 pKa = 6.62TYY148 pKa = 9.9IEE150 pKa = 4.39WASEE154 pKa = 4.33YY155 pKa = 10.81YY156 pKa = 10.65DD157 pKa = 3.9EE158 pKa = 5.76DD159 pKa = 3.46QDD161 pKa = 4.56RR162 pKa = 11.84PAPSLDD168 pKa = 3.19AVTSIYY174 pKa = 9.92QGKK177 pKa = 8.58PLTKK181 pKa = 10.18DD182 pKa = 2.91LALAIVPHH190 pKa = 7.05VEE192 pKa = 3.64DD193 pKa = 3.49WQQLEE198 pKa = 4.57RR199 pKa = 11.84DD200 pKa = 3.94LQEE203 pKa = 4.03IGYY206 pKa = 8.75PYY208 pKa = 10.89DD209 pKa = 3.7FNN211 pKa = 4.94
MM1 pKa = 7.78LSTLTYY7 pKa = 9.16TALPSQEE14 pKa = 4.14KK15 pKa = 10.15LQAICKK21 pKa = 9.65AVAVLDD27 pKa = 4.05ALNSPEE33 pKa = 3.95YY34 pKa = 9.84EE35 pKa = 3.94YY36 pKa = 10.73RR37 pKa = 11.84YY38 pKa = 10.45YY39 pKa = 11.01SYY41 pKa = 11.72NKK43 pKa = 8.7GWAEE47 pKa = 3.88GEE49 pKa = 4.53EE50 pKa = 4.26VFEE53 pKa = 4.28MQDD56 pKa = 3.46GEE58 pKa = 4.48GDD60 pKa = 3.23QMLILFRR67 pKa = 11.84AEE69 pKa = 3.71GCVINGYY76 pKa = 10.61ASDD79 pKa = 4.11YY80 pKa = 11.21EE81 pKa = 4.26EE82 pKa = 4.45SDD84 pKa = 3.4KK85 pKa = 11.72NQLTRR90 pKa = 11.84GLPDD94 pKa = 3.2VFDD97 pKa = 3.76EE98 pKa = 5.65FIFGEE103 pKa = 4.39PVNSIGTTFCLWYY116 pKa = 9.44TPAHH120 pKa = 6.54KK121 pKa = 9.62WQIGQLEE128 pKa = 4.18TDD130 pKa = 3.51EE131 pKa = 5.61DD132 pKa = 4.32GSEE135 pKa = 3.98NFLDD139 pKa = 3.82IFDD142 pKa = 5.19GNPHH146 pKa = 6.62TYY148 pKa = 9.9IEE150 pKa = 4.39WASEE154 pKa = 4.33YY155 pKa = 10.81YY156 pKa = 10.65DD157 pKa = 3.9EE158 pKa = 5.76DD159 pKa = 3.46QDD161 pKa = 4.56RR162 pKa = 11.84PAPSLDD168 pKa = 3.19AVTSIYY174 pKa = 9.92QGKK177 pKa = 8.58PLTKK181 pKa = 10.18DD182 pKa = 2.91LALAIVPHH190 pKa = 7.05VEE192 pKa = 3.64DD193 pKa = 3.49WQQLEE198 pKa = 4.57RR199 pKa = 11.84DD200 pKa = 3.94LQEE203 pKa = 4.03IGYY206 pKa = 8.75PYY208 pKa = 10.89DD209 pKa = 3.7FNN211 pKa = 4.94
Molecular weight: 24.21 kDa
Isoelectric point according different methods:
Protein with the highest isoelectric point:
>tr|A0A243W8M4|A0A243W8M4_9BACT Uncharacterized protein OS=Hymenobacter crusticola OX=1770526 GN=BXP70_24500 PE=4 SV=1
MM1 pKa = 7.57LKK3 pKa = 10.57FLGGPVAGAAAGLPPSLIWGLTVAGMMTSVVVVSGLGRR41 pKa = 11.84AWALHH46 pKa = 4.11QRR48 pKa = 11.84QRR50 pKa = 11.84RR51 pKa = 11.84QLRR54 pKa = 11.84GKK56 pKa = 9.04PLFSKK61 pKa = 10.33RR62 pKa = 11.84SRR64 pKa = 11.84GIVRR68 pKa = 11.84IFRR71 pKa = 11.84RR72 pKa = 11.84FGMPGIAFLTPILFSPIGGTVIATQLHH99 pKa = 5.21VPRR102 pKa = 11.84TRR104 pKa = 11.84ILFHH108 pKa = 6.11MLWSAAFWAAALTMLACRR126 pKa = 11.84FSHH129 pKa = 7.16LSIFHH134 pKa = 6.56HH135 pKa = 6.84
MM1 pKa = 7.57LKK3 pKa = 10.57FLGGPVAGAAAGLPPSLIWGLTVAGMMTSVVVVSGLGRR41 pKa = 11.84AWALHH46 pKa = 4.11QRR48 pKa = 11.84QRR50 pKa = 11.84RR51 pKa = 11.84QLRR54 pKa = 11.84GKK56 pKa = 9.04PLFSKK61 pKa = 10.33RR62 pKa = 11.84SRR64 pKa = 11.84GIVRR68 pKa = 11.84IFRR71 pKa = 11.84RR72 pKa = 11.84FGMPGIAFLTPILFSPIGGTVIATQLHH99 pKa = 5.21VPRR102 pKa = 11.84TRR104 pKa = 11.84ILFHH108 pKa = 6.11MLWSAAFWAAALTMLACRR126 pKa = 11.84FSHH129 pKa = 7.16LSIFHH134 pKa = 6.56HH135 pKa = 6.84
Molecular weight: 14.84 kDa
Isoelectric point according different methods:
Peptides (in silico digests for buttom-up proteomics)
Below you can find in silico digests of the whole proteome with Trypsin, Chymotrypsin, Trypsin+LysC, LysN, ArgC proteases suitable for different mass spec machines.| Try ESI |
 |
|---|
| ChTry ESI |
 |
|---|
| ArgC ESI |
 |
|---|
| LysN ESI |
 |
|---|
| TryLysC ESI |
 |
|---|
| Try MALDI |
 |
|---|
| ChTry MALDI |
 |
|---|
| ArgC MALDI |
 |
|---|
| LysN MALDI |
 |
|---|
| TryLysC MALDI |
 |
|---|
| Try LTQ |
 |
|---|
| ChTry LTQ |
 |
|---|
| ArgC LTQ |
 |
|---|
| LysN LTQ |
 |
|---|
| TryLysC LTQ |
 |
|---|
| Try MSlow |
 |
|---|
| ChTry MSlow |
 |
|---|
| ArgC MSlow |
 |
|---|
| LysN MSlow |
 |
|---|
| TryLysC MSlow |
 |
|---|
| Try MShigh |
 |
|---|
| ChTry MShigh |
 |
|---|
| ArgC MShigh |
 |
|---|
| LysN MShigh |
 |
|---|
| TryLysC MShigh |
 |
|---|
General Statistics
Number of major isoforms |
Number of additional isoforms |
Number of all proteins |
Number of amino acids |
Min. Seq. Length |
Max. Seq. Length |
Avg. Seq. Length |
Avg. Mol. Weight |
|---|---|---|---|---|---|---|---|
0 |
2016218 |
26 |
2915 |
351.6 |
38.83 |
Amino acid frequency
Ala |
Cys |
Asp |
Glu |
Phe |
Gly |
His |
Ile |
Lys |
Leu |
|---|---|---|---|---|---|---|---|---|---|
9.886 ± 0.038 | 0.697 ± 0.009 |
4.943 ± 0.024 | 5.147 ± 0.036 |
4.136 ± 0.019 | 7.457 ± 0.035 |
2.046 ± 0.017 | 4.548 ± 0.027 |
4.279 ± 0.035 | 10.748 ± 0.047 |
Met |
Asn |
Gln |
Pro |
Arg |
Ser |
Thr |
Val |
Trp |
Tyr |
|---|---|---|---|---|---|---|---|---|---|
1.821 ± 0.015 | 4.167 ± 0.033 |
4.996 ± 0.022 | 4.905 ± 0.026 |
5.613 ± 0.027 | 5.852 ± 0.027 |
6.58 ± 0.04 | 7.169 ± 0.026 |
1.296 ± 0.014 | 3.713 ± 0.022 |
Most of the basic statistics you can see at this page can be downloaded from this CSV file
Proteome-pI is available under Creative Commons Attribution-NoDerivs license, for more details see here
| Reference: Kozlowski LP. Proteome-pI 2.0: Proteome Isoelectric Point Database Update. Nucleic Acids Res. 2021, doi: 10.1093/nar/gkab944 | Contact: Lukasz P. Kozlowski |
