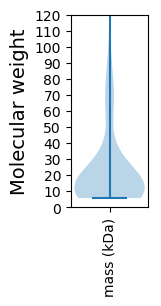
Ralstonia phage phiITL-1
Taxonomy: Viruses; Duplodnaviria; Heunggongvirae; Uroviricota; Caudoviricetes; Caudovirales; Autographiviridae; Serkorvirus; Ralstonia virus ITL1
Average proteome isoelectric point is 7.15
Get precalculated fractions of proteins

Virtual 2D-PAGE plot for 54 proteins (isoelectric point calculated using IPC2_protein)
Get csv file with sequences according to given criteria:
* You can choose from 21 different methods for calculating isoelectric point
Summary statistics related to proteome-wise predictions


Protein with the lowest isoelectric point:
>tr|A0A0U1ZDK1|A0A0U1ZDK1_9CAUD Uncharacterized protein OS=Ralstonia phage phiITL-1 OX=1597967 PE=4 SV=1
MM1 pKa = 7.7AIIVTPRR8 pKa = 11.84TEE10 pKa = 3.94LDD12 pKa = 3.21AVNAIIGAIGEE23 pKa = 4.55GVVNTLEE30 pKa = 4.12GDD32 pKa = 3.76ANVDD36 pKa = 3.3VLNARR41 pKa = 11.84RR42 pKa = 11.84LLAVVSTEE50 pKa = 4.07VQDD53 pKa = 4.22KK54 pKa = 10.51GWTFNVDD61 pKa = 2.87EE62 pKa = 5.07AFQLVPDD69 pKa = 4.54TFSSKK74 pKa = 10.34IVWLPTYY81 pKa = 10.4LRR83 pKa = 11.84VITAGGTPYY92 pKa = 10.59VNRR95 pKa = 11.84GGFVYY100 pKa = 10.54DD101 pKa = 3.38RR102 pKa = 11.84LNRR105 pKa = 11.84TDD107 pKa = 3.52QFPGRR112 pKa = 11.84ITVTMTEE119 pKa = 3.85QVPFEE124 pKa = 4.08EE125 pKa = 5.34LPLCFRR131 pKa = 11.84QYY133 pKa = 8.88ITYY136 pKa = 10.12IAADD140 pKa = 3.76RR141 pKa = 11.84FNSQFYY147 pKa = 10.13GDD149 pKa = 4.32PGVSEE154 pKa = 4.75ACAKK158 pKa = 10.62AIIEE162 pKa = 4.35ASNSVQEE169 pKa = 3.97YY170 pKa = 8.99EE171 pKa = 4.09IDD173 pKa = 3.46YY174 pKa = 11.22GGYY177 pKa = 10.4NLFNNDD183 pKa = 3.78PYY185 pKa = 11.37FLANSGRR192 pKa = 3.63
MM1 pKa = 7.7AIIVTPRR8 pKa = 11.84TEE10 pKa = 3.94LDD12 pKa = 3.21AVNAIIGAIGEE23 pKa = 4.55GVVNTLEE30 pKa = 4.12GDD32 pKa = 3.76ANVDD36 pKa = 3.3VLNARR41 pKa = 11.84RR42 pKa = 11.84LLAVVSTEE50 pKa = 4.07VQDD53 pKa = 4.22KK54 pKa = 10.51GWTFNVDD61 pKa = 2.87EE62 pKa = 5.07AFQLVPDD69 pKa = 4.54TFSSKK74 pKa = 10.34IVWLPTYY81 pKa = 10.4LRR83 pKa = 11.84VITAGGTPYY92 pKa = 10.59VNRR95 pKa = 11.84GGFVYY100 pKa = 10.54DD101 pKa = 3.38RR102 pKa = 11.84LNRR105 pKa = 11.84TDD107 pKa = 3.52QFPGRR112 pKa = 11.84ITVTMTEE119 pKa = 3.85QVPFEE124 pKa = 4.08EE125 pKa = 5.34LPLCFRR131 pKa = 11.84QYY133 pKa = 8.88ITYY136 pKa = 10.12IAADD140 pKa = 3.76RR141 pKa = 11.84FNSQFYY147 pKa = 10.13GDD149 pKa = 4.32PGVSEE154 pKa = 4.75ACAKK158 pKa = 10.62AIIEE162 pKa = 4.35ASNSVQEE169 pKa = 3.97YY170 pKa = 8.99EE171 pKa = 4.09IDD173 pKa = 3.46YY174 pKa = 11.22GGYY177 pKa = 10.4NLFNNDD183 pKa = 3.78PYY185 pKa = 11.37FLANSGRR192 pKa = 3.63
Molecular weight: 21.33 kDa
Isoelectric point according different methods:
Protein with the highest isoelectric point:
>tr|A0A0U1ZI53|A0A0U1ZI53_9CAUD DNA primase/helicase-like protein OS=Ralstonia phage phiITL-1 OX=1597967 PE=4 SV=1
MM1 pKa = 7.54NLRR4 pKa = 11.84NAPALGYY11 pKa = 8.99TYY13 pKa = 11.26AEE15 pKa = 3.74ARR17 pKa = 11.84AAGFLSATSPEE28 pKa = 3.79AWAATQQVNHH38 pKa = 5.93MVLTATDD45 pKa = 4.03PVLKK49 pKa = 10.59GQAEE53 pKa = 4.03EE54 pKa = 4.2RR55 pKa = 11.84ARR57 pKa = 11.84KK58 pKa = 8.89ALKK61 pKa = 10.41DD62 pKa = 3.43SLRR65 pKa = 11.84RR66 pKa = 11.84AMGMAATGHH75 pKa = 6.14GPVGVHH81 pKa = 6.18RR82 pKa = 11.84KK83 pKa = 8.09GTITVSRR90 pKa = 11.84EE91 pKa = 3.31EE92 pKa = 3.86ARR94 pKa = 11.84AA95 pKa = 3.33
MM1 pKa = 7.54NLRR4 pKa = 11.84NAPALGYY11 pKa = 8.99TYY13 pKa = 11.26AEE15 pKa = 3.74ARR17 pKa = 11.84AAGFLSATSPEE28 pKa = 3.79AWAATQQVNHH38 pKa = 5.93MVLTATDD45 pKa = 4.03PVLKK49 pKa = 10.59GQAEE53 pKa = 4.03EE54 pKa = 4.2RR55 pKa = 11.84ARR57 pKa = 11.84KK58 pKa = 8.89ALKK61 pKa = 10.41DD62 pKa = 3.43SLRR65 pKa = 11.84RR66 pKa = 11.84AMGMAATGHH75 pKa = 6.14GPVGVHH81 pKa = 6.18RR82 pKa = 11.84KK83 pKa = 8.09GTITVSRR90 pKa = 11.84EE91 pKa = 3.31EE92 pKa = 3.86ARR94 pKa = 11.84AA95 pKa = 3.33
Molecular weight: 10.12 kDa
Isoelectric point according different methods:
Peptides (in silico digests for buttom-up proteomics)
Below you can find in silico digests of the whole proteome with Trypsin, Chymotrypsin, Trypsin+LysC, LysN, ArgC proteases suitable for different mass spec machines.| Try ESI |
 |
|---|
| ChTry ESI |
 |
|---|
| ArgC ESI |
 |
|---|
| LysN ESI |
 |
|---|
| TryLysC ESI |
 |
|---|
| Try MALDI |
 |
|---|
| ChTry MALDI |
 |
|---|
| ArgC MALDI |
 |
|---|
| LysN MALDI |
 |
|---|
| TryLysC MALDI |
 |
|---|
| Try LTQ |
 |
|---|
| ChTry LTQ |
 |
|---|
| ArgC LTQ |
 |
|---|
| LysN LTQ |
 |
|---|
| TryLysC LTQ |
 |
|---|
| Try MSlow |
 |
|---|
| ChTry MSlow |
 |
|---|
| ArgC MSlow |
 |
|---|
| LysN MSlow |
 |
|---|
| TryLysC MSlow |
 |
|---|
| Try MShigh |
 |
|---|
| ChTry MShigh |
 |
|---|
| ArgC MShigh |
 |
|---|
| LysN MShigh |
 |
|---|
| TryLysC MShigh |
 |
|---|
General Statistics
Number of major isoforms |
Number of additional isoforms |
Number of all proteins |
Number of amino acids |
Min. Seq. Length |
Max. Seq. Length |
Avg. Seq. Length |
Avg. Mol. Weight |
|---|---|---|---|---|---|---|---|
0 |
11670 |
52 |
1294 |
216.1 |
23.73 |
Amino acid frequency
Ala |
Cys |
Asp |
Glu |
Phe |
Gly |
His |
Ile |
Lys |
Leu |
|---|---|---|---|---|---|---|---|---|---|
11.285 ± 0.528 | 1.011 ± 0.226 |
5.827 ± 0.261 | 6.401 ± 0.271 |
3.385 ± 0.163 | 8.423 ± 0.378 |
2.014 ± 0.288 | 4.516 ± 0.212 |
5.338 ± 0.319 | 7.669 ± 0.33 |
Met |
Asn |
Gln |
Pro |
Arg |
Ser |
Thr |
Val |
Trp |
Tyr |
|---|---|---|---|---|---|---|---|---|---|
2.271 ± 0.128 | 3.599 ± 0.269 |
4.687 ± 0.263 | 4.045 ± 0.347 |
6.71 ± 0.281 | 5.553 ± 0.279 |
5.698 ± 0.293 | 7.232 ± 0.204 |
1.568 ± 0.156 | 2.768 ± 0.147 |
Most of the basic statistics you can see at this page can be downloaded from this CSV file
Proteome-pI is available under Creative Commons Attribution-NoDerivs license, for more details see here
| Reference: Kozlowski LP. Proteome-pI 2.0: Proteome Isoelectric Point Database Update. Nucleic Acids Res. 2021, doi: 10.1093/nar/gkab944 | Contact: Lukasz P. Kozlowski |
