Cherry necrotic rusty mottle virus
Taxonomy: Viruses; Riboviria; Orthornavirae; Kitrinoviricota; Alsuviricetes; Tymovirales; Betaflexiviridae; Quinvirinae; Robigovirus
Average proteome isoelectric point is 7.12
Get precalculated fractions of proteins

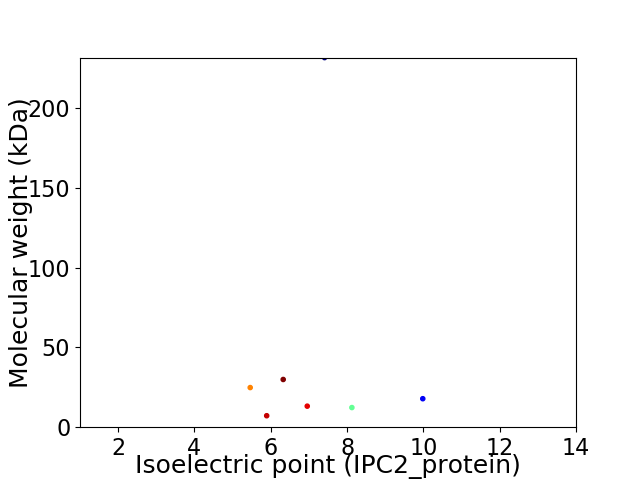
Virtual 2D-PAGE plot for 7 proteins (isoelectric point calculated using IPC2_protein)
Get csv file with sequences according to given criteria:
* You can choose from 21 different methods for calculating isoelectric point
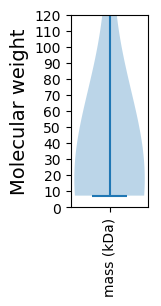
Summary statistics related to proteome-wise predictions


Protein with the lowest isoelectric point:
>tr|Q9IH80|Q9IH80_9VIRU Helicase OS=Cherry necrotic rusty mottle virus OX=129143 GN=orf1 PE=3 SV=1
MM1 pKa = 6.52EE2 pKa = 5.73TIYY5 pKa = 11.19SRR7 pKa = 11.84LLNANFSRR15 pKa = 11.84TSFPISFPVVVHH27 pKa = 6.18GVPGCGKK34 pKa = 8.52STFIKK39 pKa = 10.7SLLDD43 pKa = 3.53CEE45 pKa = 4.52EE46 pKa = 5.17FSAQSYY52 pKa = 9.58GVVRR56 pKa = 11.84PTNLAGRR63 pKa = 11.84GVEE66 pKa = 4.54KK67 pKa = 10.45ALQPLQPGFNVLDD80 pKa = 4.62EE81 pKa = 4.4YY82 pKa = 11.6LSGPSYY88 pKa = 11.04EE89 pKa = 5.09GFDD92 pKa = 4.41LLLSDD97 pKa = 5.16PYY99 pKa = 11.53QNFRR103 pKa = 11.84KK104 pKa = 9.6PLTAHH109 pKa = 7.21FINSNTYY116 pKa = 8.28RR117 pKa = 11.84FGVSVCQFLNKK128 pKa = 10.25LGFEE132 pKa = 4.17INSCKK137 pKa = 10.68EE138 pKa = 3.43EE139 pKa = 3.99DD140 pKa = 3.62TEE142 pKa = 5.7LIFGKK147 pKa = 10.51VFGGEE152 pKa = 3.45IRR154 pKa = 11.84GEE156 pKa = 4.12IICFEE161 pKa = 4.38AEE163 pKa = 3.79VEE165 pKa = 4.29EE166 pKa = 4.38ILRR169 pKa = 11.84KK170 pKa = 9.86HH171 pKa = 5.36SAKK174 pKa = 9.95FHH176 pKa = 6.33HH177 pKa = 7.01PCNLRR182 pKa = 11.84GAEE185 pKa = 3.97FDD187 pKa = 3.3HH188 pKa = 6.11VTFITAHH195 pKa = 6.27QDD197 pKa = 3.0LQEE200 pKa = 4.22IVGPDD205 pKa = 3.72LYY207 pKa = 11.58VSLTRR212 pKa = 11.84ATKK215 pKa = 10.46SLTILSPP222 pKa = 3.64
MM1 pKa = 6.52EE2 pKa = 5.73TIYY5 pKa = 11.19SRR7 pKa = 11.84LLNANFSRR15 pKa = 11.84TSFPISFPVVVHH27 pKa = 6.18GVPGCGKK34 pKa = 8.52STFIKK39 pKa = 10.7SLLDD43 pKa = 3.53CEE45 pKa = 4.52EE46 pKa = 5.17FSAQSYY52 pKa = 9.58GVVRR56 pKa = 11.84PTNLAGRR63 pKa = 11.84GVEE66 pKa = 4.54KK67 pKa = 10.45ALQPLQPGFNVLDD80 pKa = 4.62EE81 pKa = 4.4YY82 pKa = 11.6LSGPSYY88 pKa = 11.04EE89 pKa = 5.09GFDD92 pKa = 4.41LLLSDD97 pKa = 5.16PYY99 pKa = 11.53QNFRR103 pKa = 11.84KK104 pKa = 9.6PLTAHH109 pKa = 7.21FINSNTYY116 pKa = 8.28RR117 pKa = 11.84FGVSVCQFLNKK128 pKa = 10.25LGFEE132 pKa = 4.17INSCKK137 pKa = 10.68EE138 pKa = 3.43EE139 pKa = 3.99DD140 pKa = 3.62TEE142 pKa = 5.7LIFGKK147 pKa = 10.51VFGGEE152 pKa = 3.45IRR154 pKa = 11.84GEE156 pKa = 4.12IICFEE161 pKa = 4.38AEE163 pKa = 3.79VEE165 pKa = 4.29EE166 pKa = 4.38ILRR169 pKa = 11.84KK170 pKa = 9.86HH171 pKa = 5.36SAKK174 pKa = 9.95FHH176 pKa = 6.33HH177 pKa = 7.01PCNLRR182 pKa = 11.84GAEE185 pKa = 3.97FDD187 pKa = 3.3HH188 pKa = 6.11VTFITAHH195 pKa = 6.27QDD197 pKa = 3.0LQEE200 pKa = 4.22IVGPDD205 pKa = 3.72LYY207 pKa = 11.58VSLTRR212 pKa = 11.84ATKK215 pKa = 10.46SLTILSPP222 pKa = 3.64
Molecular weight: 24.83 kDa
Isoelectric point according different methods:
Protein with the highest isoelectric point:
>tr|Q9IH75|Q9IH75_9VIRU Capsid protein OS=Cherry necrotic rusty mottle virus OX=129143 GN=orf5 PE=4 SV=1
MM1 pKa = 7.11MMEE4 pKa = 5.16PLNLMLQTTRR14 pKa = 11.84SRR16 pKa = 11.84RR17 pKa = 11.84RR18 pKa = 11.84RR19 pKa = 11.84RR20 pKa = 11.84LGQPLHH26 pKa = 6.02FPGMKK31 pKa = 9.51RR32 pKa = 11.84VLQEE36 pKa = 3.49RR37 pKa = 11.84AILKK41 pKa = 10.55FSDD44 pKa = 3.61QEE46 pKa = 4.2EE47 pKa = 4.94GEE49 pKa = 4.23LTSIQRR55 pKa = 11.84IPPQVLAEE63 pKa = 4.17SLSATFRR70 pKa = 11.84KK71 pKa = 8.61RR72 pKa = 11.84TLQLSTLHH80 pKa = 7.0LMTQLKK86 pKa = 9.1QLQPIGLSTSKK97 pKa = 10.6CLSLKK102 pKa = 10.47RR103 pKa = 11.84SIAFSMLSGTVTTTAQVTKK122 pKa = 9.83QNSWAEE128 pKa = 4.04PNVMSNLRR136 pKa = 11.84NWQALLGATALYY148 pKa = 10.32VAFVLNTRR156 pKa = 11.84QQ157 pKa = 3.07
MM1 pKa = 7.11MMEE4 pKa = 5.16PLNLMLQTTRR14 pKa = 11.84SRR16 pKa = 11.84RR17 pKa = 11.84RR18 pKa = 11.84RR19 pKa = 11.84RR20 pKa = 11.84LGQPLHH26 pKa = 6.02FPGMKK31 pKa = 9.51RR32 pKa = 11.84VLQEE36 pKa = 3.49RR37 pKa = 11.84AILKK41 pKa = 10.55FSDD44 pKa = 3.61QEE46 pKa = 4.2EE47 pKa = 4.94GEE49 pKa = 4.23LTSIQRR55 pKa = 11.84IPPQVLAEE63 pKa = 4.17SLSATFRR70 pKa = 11.84KK71 pKa = 8.61RR72 pKa = 11.84TLQLSTLHH80 pKa = 7.0LMTQLKK86 pKa = 9.1QLQPIGLSTSKK97 pKa = 10.6CLSLKK102 pKa = 10.47RR103 pKa = 11.84SIAFSMLSGTVTTTAQVTKK122 pKa = 9.83QNSWAEE128 pKa = 4.04PNVMSNLRR136 pKa = 11.84NWQALLGATALYY148 pKa = 10.32VAFVLNTRR156 pKa = 11.84QQ157 pKa = 3.07
Molecular weight: 17.85 kDa
Isoelectric point according different methods:
Peptides (in silico digests for buttom-up proteomics)
Below you can find in silico digests of the whole proteome with Trypsin, Chymotrypsin, Trypsin+LysC, LysN, ArgC proteases suitable for different mass spec machines.| Try ESI |
 |
|---|
| ChTry ESI |
 |
|---|
| ArgC ESI |
 |
|---|
| LysN ESI |
 |
|---|
| TryLysC ESI |
 |
|---|
| Try MALDI |
 |
|---|
| ChTry MALDI |
 |
|---|
| ArgC MALDI |
 |
|---|
| LysN MALDI |
 |
|---|
| TryLysC MALDI |
 |
|---|
| Try LTQ |
 |
|---|
| ChTry LTQ |
 |
|---|
| ArgC LTQ |
 |
|---|
| LysN LTQ |
 |
|---|
| TryLysC LTQ |
 |
|---|
| Try MSlow |
 |
|---|
| ChTry MSlow |
 |
|---|
| ArgC MSlow |
 |
|---|
| LysN MSlow |
 |
|---|
| TryLysC MSlow |
 |
|---|
| Try MShigh |
 |
|---|
| ChTry MShigh |
 |
|---|
| ArgC MShigh |
 |
|---|
| LysN MShigh |
 |
|---|
| TryLysC MShigh |
 |
|---|
General Statistics
Number of major isoforms |
Number of additional isoforms |
Number of all proteins |
Number of amino acids |
Min. Seq. Length |
Max. Seq. Length |
Avg. Seq. Length |
Avg. Mol. Weight |
|---|---|---|---|---|---|---|---|
0 |
2985 |
67 |
2038 |
426.4 |
48.12 |
Amino acid frequency
Ala |
Cys |
Asp |
Glu |
Phe |
Gly |
His |
Ile |
Lys |
Leu |
|---|---|---|---|---|---|---|---|---|---|
6.097 ± 0.48 | 2.01 ± 0.379 |
4.958 ± 1.013 | 6.365 ± 1.061 |
6.365 ± 0.816 | 5.595 ± 0.533 |
2.278 ± 0.429 | 5.863 ± 0.557 |
6.901 ± 1.544 | 10.888 ± 2.017 |
Met |
Asn |
Gln |
Pro |
Arg |
Ser |
Thr |
Val |
Trp |
Tyr |
|---|---|---|---|---|---|---|---|---|---|
1.977 ± 0.449 | 4.757 ± 0.147 |
3.92 ± 0.793 | 3.149 ± 0.65 |
5.226 ± 0.638 | 9.313 ± 0.513 |
4.824 ± 1.06 | 5.796 ± 0.582 |
0.737 ± 0.235 | 2.982 ± 0.416 |
Most of the basic statistics you can see at this page can be downloaded from this CSV file
Proteome-pI is available under Creative Commons Attribution-NoDerivs license, for more details see here
| Reference: Kozlowski LP. Proteome-pI 2.0: Proteome Isoelectric Point Database Update. Nucleic Acids Res. 2021, doi: 10.1093/nar/gkab944 | Contact: Lukasz P. Kozlowski |
