Torque teno mini virus 11
Taxonomy: Viruses; Anelloviridae; Betatorquevirus
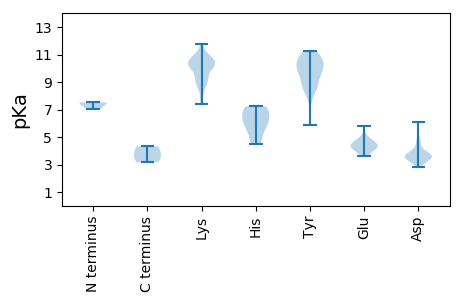
Average proteome isoelectric point is 7.54
Get precalculated fractions of proteins

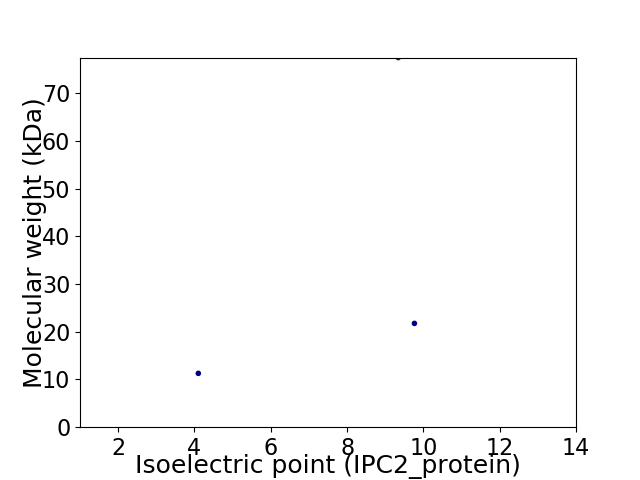
Virtual 2D-PAGE plot for 3 proteins (isoelectric point calculated using IPC2_protein)
Get csv file with sequences according to given criteria:
* You can choose from 21 different methods for calculating isoelectric point
Summary statistics related to proteome-wise predictions


Protein with the lowest isoelectric point:
>tr|A8DMQ9|A8DMQ9_9VIRU Capsid protein OS=Torque teno mini virus 11 OX=2065037 PE=3 SV=1
MM1 pKa = 7.47SYY3 pKa = 10.56KK4 pKa = 10.09PPRR7 pKa = 11.84YY8 pKa = 9.37GPQGLEE14 pKa = 3.76LQFLNSIFTNHH25 pKa = 7.22DD26 pKa = 3.97LFCGCDD32 pKa = 3.34DD33 pKa = 3.9TLKK36 pKa = 10.77HH37 pKa = 6.21ILSIFNKK44 pKa = 8.89QNKK47 pKa = 9.46ANLSDD52 pKa = 3.61TKK54 pKa = 10.56IQEE57 pKa = 4.31IKK59 pKa = 10.69CLLTGEE65 pKa = 4.35TTEE68 pKa = 4.66TGDD71 pKa = 4.62KK72 pKa = 10.92GDD74 pKa = 3.72GAAGVLDD81 pKa = 5.08AIEE84 pKa = 5.79DD85 pKa = 3.84GDD87 pKa = 4.45LDD89 pKa = 4.6ALFEE93 pKa = 5.04LSDD96 pKa = 6.07DD97 pKa = 3.61MDD99 pKa = 4.01EE100 pKa = 4.68PNGG103 pKa = 3.73
MM1 pKa = 7.47SYY3 pKa = 10.56KK4 pKa = 10.09PPRR7 pKa = 11.84YY8 pKa = 9.37GPQGLEE14 pKa = 3.76LQFLNSIFTNHH25 pKa = 7.22DD26 pKa = 3.97LFCGCDD32 pKa = 3.34DD33 pKa = 3.9TLKK36 pKa = 10.77HH37 pKa = 6.21ILSIFNKK44 pKa = 8.89QNKK47 pKa = 9.46ANLSDD52 pKa = 3.61TKK54 pKa = 10.56IQEE57 pKa = 4.31IKK59 pKa = 10.69CLLTGEE65 pKa = 4.35TTEE68 pKa = 4.66TGDD71 pKa = 4.62KK72 pKa = 10.92GDD74 pKa = 3.72GAAGVLDD81 pKa = 5.08AIEE84 pKa = 5.79DD85 pKa = 3.84GDD87 pKa = 4.45LDD89 pKa = 4.6ALFEE93 pKa = 5.04LSDD96 pKa = 6.07DD97 pKa = 3.61MDD99 pKa = 4.01EE100 pKa = 4.68PNGG103 pKa = 3.73
Molecular weight: 11.28 kDa
Isoelectric point according different methods:
Protein with the highest isoelectric point:
>tr|A8DMR0|A8DMR0_9VIRU ORF3 OS=Torque teno mini virus 11 OX=2065037 PE=4 SV=1
MM1 pKa = 7.52IPVHH5 pKa = 5.74SQNGPQPVTSNKK17 pKa = 7.76QFRR20 pKa = 11.84SRR22 pKa = 11.84IQNTTQATTSTLGTLEE38 pKa = 4.05GTFLQTQLSKK48 pKa = 11.03DD49 pKa = 3.39LKK51 pKa = 9.18KK52 pKa = 9.31TKK54 pKa = 10.67KK55 pKa = 10.29LMRR58 pKa = 11.84LFQLKK63 pKa = 9.14QAQKK67 pKa = 8.6AAKK70 pKa = 8.87RR71 pKa = 11.84RR72 pKa = 11.84SPSPPNTPRR81 pKa = 11.84KK82 pKa = 9.36LRR84 pKa = 11.84RR85 pKa = 11.84SIDD88 pKa = 3.31TGKK91 pKa = 10.6KK92 pKa = 9.66EE93 pKa = 4.45RR94 pKa = 11.84DD95 pKa = 3.29TAAQAPQTPTKK106 pKa = 10.41PPATTAAAHH115 pKa = 6.09QIPKK119 pKa = 8.45ITIIHH124 pKa = 6.25KK125 pKa = 9.3PVKK128 pKa = 10.01INLFNDD134 pKa = 3.78PVPVKK139 pKa = 10.57NRR141 pKa = 11.84PFKK144 pKa = 8.89PWEE147 pKa = 3.82WEE149 pKa = 3.85DD150 pKa = 3.54EE151 pKa = 4.15KK152 pKa = 11.47FIASWLKK159 pKa = 10.03RR160 pKa = 11.84PQRR163 pKa = 11.84HH164 pKa = 4.94YY165 pKa = 10.71FYY167 pKa = 10.87DD168 pKa = 3.71KK169 pKa = 8.61PTYY172 pKa = 9.64PIFPITPLANFDD184 pKa = 4.92LNFKK188 pKa = 9.75EE189 pKa = 4.32
MM1 pKa = 7.52IPVHH5 pKa = 5.74SQNGPQPVTSNKK17 pKa = 7.76QFRR20 pKa = 11.84SRR22 pKa = 11.84IQNTTQATTSTLGTLEE38 pKa = 4.05GTFLQTQLSKK48 pKa = 11.03DD49 pKa = 3.39LKK51 pKa = 9.18KK52 pKa = 9.31TKK54 pKa = 10.67KK55 pKa = 10.29LMRR58 pKa = 11.84LFQLKK63 pKa = 9.14QAQKK67 pKa = 8.6AAKK70 pKa = 8.87RR71 pKa = 11.84RR72 pKa = 11.84SPSPPNTPRR81 pKa = 11.84KK82 pKa = 9.36LRR84 pKa = 11.84RR85 pKa = 11.84SIDD88 pKa = 3.31TGKK91 pKa = 10.6KK92 pKa = 9.66EE93 pKa = 4.45RR94 pKa = 11.84DD95 pKa = 3.29TAAQAPQTPTKK106 pKa = 10.41PPATTAAAHH115 pKa = 6.09QIPKK119 pKa = 8.45ITIIHH124 pKa = 6.25KK125 pKa = 9.3PVKK128 pKa = 10.01INLFNDD134 pKa = 3.78PVPVKK139 pKa = 10.57NRR141 pKa = 11.84PFKK144 pKa = 8.89PWEE147 pKa = 3.82WEE149 pKa = 3.85DD150 pKa = 3.54EE151 pKa = 4.15KK152 pKa = 11.47FIASWLKK159 pKa = 10.03RR160 pKa = 11.84PQRR163 pKa = 11.84HH164 pKa = 4.94YY165 pKa = 10.71FYY167 pKa = 10.87DD168 pKa = 3.71KK169 pKa = 8.61PTYY172 pKa = 9.64PIFPITPLANFDD184 pKa = 4.92LNFKK188 pKa = 9.75EE189 pKa = 4.32
Molecular weight: 21.75 kDa
Isoelectric point according different methods:
Peptides (in silico digests for buttom-up proteomics)
Below you can find in silico digests of the whole proteome with Trypsin, Chymotrypsin, Trypsin+LysC, LysN, ArgC proteases suitable for different mass spec machines.| Try ESI |
 |
|---|
| ChTry ESI |
 |
|---|
| ArgC ESI |
 |
|---|
| LysN ESI |
 |
|---|
| TryLysC ESI |
 |
|---|
| Try MALDI |
 |
|---|
| ChTry MALDI |
 |
|---|
| ArgC MALDI |
 |
|---|
| LysN MALDI |
 |
|---|
| TryLysC MALDI |
 |
|---|
| Try LTQ |
 |
|---|
| ChTry LTQ |
 |
|---|
| ArgC LTQ |
 |
|---|
| LysN LTQ |
 |
|---|
| TryLysC LTQ |
 |
|---|
| Try MSlow |
 |
|---|
| ChTry MSlow |
 |
|---|
| ArgC MSlow |
 |
|---|
| LysN MSlow |
 |
|---|
| TryLysC MSlow |
 |
|---|
| Try MShigh |
 |
|---|
| ChTry MShigh |
 |
|---|
| ArgC MShigh |
 |
|---|
| LysN MShigh |
 |
|---|
| TryLysC MShigh |
 |
|---|
General Statistics
Number of major isoforms |
Number of additional isoforms |
Number of all proteins |
Number of amino acids |
Min. Seq. Length |
Max. Seq. Length |
Avg. Seq. Length |
Avg. Mol. Weight |
|---|---|---|---|---|---|---|---|
0 |
954 |
103 |
662 |
318.0 |
36.83 |
Amino acid frequency
Ala |
Cys |
Asp |
Glu |
Phe |
Gly |
His |
Ile |
Lys |
Leu |
|---|---|---|---|---|---|---|---|---|---|
4.403 ± 0.948 | 1.363 ± 0.536 |
5.451 ± 1.783 | 3.774 ± 0.752 |
4.298 ± 0.431 | 4.927 ± 1.351 |
1.782 ± 0.141 | 5.556 ± 0.136 |
9.434 ± 0.885 | 7.442 ± 1.304 |
Met |
Asn |
Gln |
Pro |
Arg |
Ser |
Thr |
Val |
Trp |
Tyr |
|---|---|---|---|---|---|---|---|---|---|
1.468 ± 0.162 | 6.184 ± 0.556 |
7.128 ± 1.605 | 4.927 ± 0.862 |
5.975 ± 1.272 | 7.652 ± 1.458 |
8.071 ± 0.874 | 2.935 ± 0.555 |
2.621 ± 0.878 | 4.612 ± 1.478 |
Most of the basic statistics you can see at this page can be downloaded from this CSV file
Proteome-pI is available under Creative Commons Attribution-NoDerivs license, for more details see here
| Reference: Kozlowski LP. Proteome-pI 2.0: Proteome Isoelectric Point Database Update. Nucleic Acids Res. 2021, doi: 10.1093/nar/gkab944 | Contact: Lukasz P. Kozlowski |
