Gordonia phage NatB6
Taxonomy: Viruses; Duplodnaviria; Heunggongvirae; Uroviricota; Caudoviricetes; Caudovirales; Siphoviridae; unclassified Siphoviridae
Average proteome isoelectric point is 6.28
Get precalculated fractions of proteins

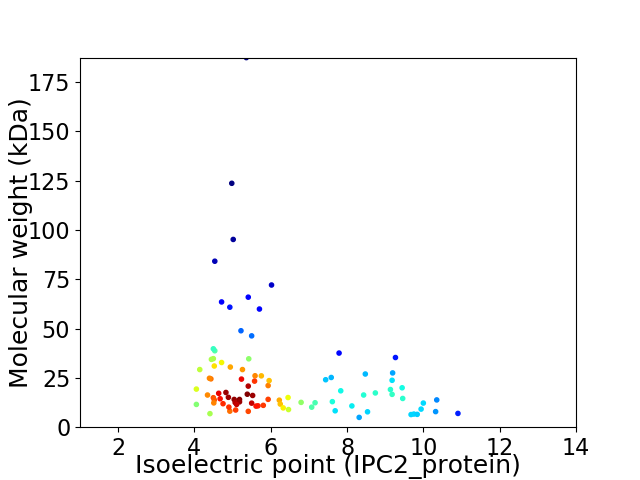
Virtual 2D-PAGE plot for 93 proteins (isoelectric point calculated using IPC2_protein)
Get csv file with sequences according to given criteria:
* You can choose from 21 different methods for calculating isoelectric point
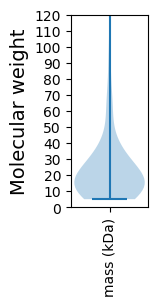
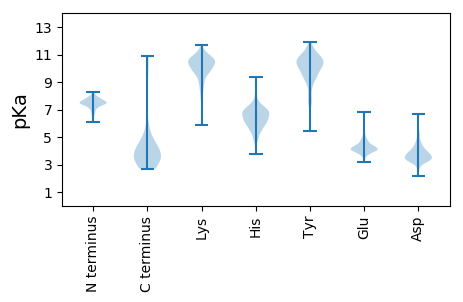
Summary statistics related to proteome-wise predictions


Protein with the lowest isoelectric point:
>tr|A0A345L515|A0A345L515_9CAUD Uncharacterized protein OS=Gordonia phage NatB6 OX=2250322 GN=87 PE=4 SV=1
MM1 pKa = 6.62THH3 pKa = 6.46SPAASDD9 pKa = 3.98VIATRR14 pKa = 11.84TLDD17 pKa = 3.7PVDD20 pKa = 4.51GFTLTAFEE28 pKa = 4.91VPDD31 pKa = 4.04TDD33 pKa = 3.76STPIGQSLDD42 pKa = 3.24EE43 pKa = 4.79GGCYY47 pKa = 8.92TADD50 pKa = 5.31DD51 pKa = 3.72IEE53 pKa = 4.04AWRR56 pKa = 11.84RR57 pKa = 11.84DD58 pKa = 2.76EE59 pKa = 3.88WQYY62 pKa = 11.21VGVVVVASRR71 pKa = 11.84AGVDD75 pKa = 3.79LGSASIWGMDD85 pKa = 3.27TGDD88 pKa = 3.48YY89 pKa = 10.09WDD91 pKa = 5.58AITRR95 pKa = 11.84ADD97 pKa = 3.04GRR99 pKa = 11.84TPYY102 pKa = 10.7GVLDD106 pKa = 3.78NVPNSVTTGHH116 pKa = 6.78PQPDD120 pKa = 3.54GTIDD124 pKa = 3.34YY125 pKa = 7.52VTRR128 pKa = 11.84DD129 pKa = 4.14DD130 pKa = 3.93FAHH133 pKa = 7.2GYY135 pKa = 9.33GADD138 pKa = 4.51LISEE142 pKa = 4.69ALTEE146 pKa = 4.09ARR148 pKa = 11.84ATVAALTSPDD158 pKa = 3.52VVIPVCDD165 pKa = 3.49EE166 pKa = 3.96CGEE169 pKa = 4.22RR170 pKa = 11.84ADD172 pKa = 4.52GVSDD176 pKa = 3.42AHH178 pKa = 6.9GVACSLFAGNVAGYY192 pKa = 8.15TDD194 pKa = 4.79EE195 pKa = 5.01VPAPTFYY202 pKa = 10.52PGAGGWHH209 pKa = 5.59TEE211 pKa = 3.81QRR213 pKa = 11.84GTCTYY218 pKa = 10.45HH219 pKa = 5.82VATIAGGHH227 pKa = 5.79RR228 pKa = 11.84AAYY231 pKa = 7.83VTLNDD236 pKa = 3.43ANEE239 pKa = 4.27YY240 pKa = 10.09VAGLYY245 pKa = 7.74DD246 pKa = 3.76TTDD249 pKa = 3.39TPHH252 pKa = 7.12VIGTFPTLFDD262 pKa = 3.78GKK264 pKa = 10.04RR265 pKa = 11.84AADD268 pKa = 3.53AARR271 pKa = 11.84EE272 pKa = 4.02RR273 pKa = 11.84GSVKK277 pKa = 10.58
MM1 pKa = 6.62THH3 pKa = 6.46SPAASDD9 pKa = 3.98VIATRR14 pKa = 11.84TLDD17 pKa = 3.7PVDD20 pKa = 4.51GFTLTAFEE28 pKa = 4.91VPDD31 pKa = 4.04TDD33 pKa = 3.76STPIGQSLDD42 pKa = 3.24EE43 pKa = 4.79GGCYY47 pKa = 8.92TADD50 pKa = 5.31DD51 pKa = 3.72IEE53 pKa = 4.04AWRR56 pKa = 11.84RR57 pKa = 11.84DD58 pKa = 2.76EE59 pKa = 3.88WQYY62 pKa = 11.21VGVVVVASRR71 pKa = 11.84AGVDD75 pKa = 3.79LGSASIWGMDD85 pKa = 3.27TGDD88 pKa = 3.48YY89 pKa = 10.09WDD91 pKa = 5.58AITRR95 pKa = 11.84ADD97 pKa = 3.04GRR99 pKa = 11.84TPYY102 pKa = 10.7GVLDD106 pKa = 3.78NVPNSVTTGHH116 pKa = 6.78PQPDD120 pKa = 3.54GTIDD124 pKa = 3.34YY125 pKa = 7.52VTRR128 pKa = 11.84DD129 pKa = 4.14DD130 pKa = 3.93FAHH133 pKa = 7.2GYY135 pKa = 9.33GADD138 pKa = 4.51LISEE142 pKa = 4.69ALTEE146 pKa = 4.09ARR148 pKa = 11.84ATVAALTSPDD158 pKa = 3.52VVIPVCDD165 pKa = 3.49EE166 pKa = 3.96CGEE169 pKa = 4.22RR170 pKa = 11.84ADD172 pKa = 4.52GVSDD176 pKa = 3.42AHH178 pKa = 6.9GVACSLFAGNVAGYY192 pKa = 8.15TDD194 pKa = 4.79EE195 pKa = 5.01VPAPTFYY202 pKa = 10.52PGAGGWHH209 pKa = 5.59TEE211 pKa = 3.81QRR213 pKa = 11.84GTCTYY218 pKa = 10.45HH219 pKa = 5.82VATIAGGHH227 pKa = 5.79RR228 pKa = 11.84AAYY231 pKa = 7.83VTLNDD236 pKa = 3.43ANEE239 pKa = 4.27YY240 pKa = 10.09VAGLYY245 pKa = 7.74DD246 pKa = 3.76TTDD249 pKa = 3.39TPHH252 pKa = 7.12VIGTFPTLFDD262 pKa = 3.78GKK264 pKa = 10.04RR265 pKa = 11.84AADD268 pKa = 3.53AARR271 pKa = 11.84EE272 pKa = 4.02RR273 pKa = 11.84GSVKK277 pKa = 10.58
Molecular weight: 29.23 kDa
Isoelectric point according different methods:
Protein with the highest isoelectric point:
>tr|A0A345L4V1|A0A345L4V1_9CAUD HNH endonuclease OS=Gordonia phage NatB6 OX=2250322 GN=23 PE=4 SV=1
MM1 pKa = 6.82ATRR4 pKa = 11.84RR5 pKa = 11.84RR6 pKa = 11.84RR7 pKa = 11.84GGSLNTRR14 pKa = 11.84KK15 pKa = 9.98KK16 pKa = 10.82GKK18 pKa = 10.05AKK20 pKa = 10.66NGAKK24 pKa = 9.07WGHH27 pKa = 5.7GFVPKK32 pKa = 10.29NAAARR37 pKa = 11.84KK38 pKa = 9.03LKK40 pKa = 10.66KK41 pKa = 10.41KK42 pKa = 10.3LDD44 pKa = 3.9RR45 pKa = 11.84NGKK48 pKa = 7.93RR49 pKa = 11.84RR50 pKa = 11.84KK51 pKa = 8.79RR52 pKa = 11.84TSQGYY57 pKa = 7.24PKK59 pKa = 10.37KK60 pKa = 10.56RR61 pKa = 3.29
MM1 pKa = 6.82ATRR4 pKa = 11.84RR5 pKa = 11.84RR6 pKa = 11.84RR7 pKa = 11.84GGSLNTRR14 pKa = 11.84KK15 pKa = 9.98KK16 pKa = 10.82GKK18 pKa = 10.05AKK20 pKa = 10.66NGAKK24 pKa = 9.07WGHH27 pKa = 5.7GFVPKK32 pKa = 10.29NAAARR37 pKa = 11.84KK38 pKa = 9.03LKK40 pKa = 10.66KK41 pKa = 10.41KK42 pKa = 10.3LDD44 pKa = 3.9RR45 pKa = 11.84NGKK48 pKa = 7.93RR49 pKa = 11.84RR50 pKa = 11.84KK51 pKa = 8.79RR52 pKa = 11.84TSQGYY57 pKa = 7.24PKK59 pKa = 10.37KK60 pKa = 10.56RR61 pKa = 3.29
Molecular weight: 6.99 kDa
Isoelectric point according different methods:
Peptides (in silico digests for buttom-up proteomics)
Below you can find in silico digests of the whole proteome with Trypsin, Chymotrypsin, Trypsin+LysC, LysN, ArgC proteases suitable for different mass spec machines.| Try ESI |
 |
|---|
| ChTry ESI |
 |
|---|
| ArgC ESI |
 |
|---|
| LysN ESI |
 |
|---|
| TryLysC ESI |
 |
|---|
| Try MALDI |
 |
|---|
| ChTry MALDI |
 |
|---|
| ArgC MALDI |
 |
|---|
| LysN MALDI |
 |
|---|
| TryLysC MALDI |
 |
|---|
| Try LTQ |
 |
|---|
| ChTry LTQ |
 |
|---|
| ArgC LTQ |
 |
|---|
| LysN LTQ |
 |
|---|
| TryLysC LTQ |
 |
|---|
| Try MSlow |
 |
|---|
| ChTry MSlow |
 |
|---|
| ArgC MSlow |
 |
|---|
| LysN MSlow |
 |
|---|
| TryLysC MSlow |
 |
|---|
| Try MShigh |
 |
|---|
| ChTry MShigh |
 |
|---|
| ArgC MShigh |
 |
|---|
| LysN MShigh |
 |
|---|
| TryLysC MShigh |
 |
|---|
General Statistics
Number of major isoforms |
Number of additional isoforms |
Number of all proteins |
Number of amino acids |
Min. Seq. Length |
Max. Seq. Length |
Avg. Seq. Length |
Avg. Mol. Weight |
|---|---|---|---|---|---|---|---|
0 |
21352 |
41 |
1797 |
229.6 |
25.3 |
Amino acid frequency
Ala |
Cys |
Asp |
Glu |
Phe |
Gly |
His |
Ile |
Lys |
Leu |
|---|---|---|---|---|---|---|---|---|---|
10.126 ± 0.427 | 0.852 ± 0.131 |
7.255 ± 0.314 | 6.487 ± 0.277 |
3.082 ± 0.142 | 8.585 ± 0.372 |
1.911 ± 0.133 | 4.927 ± 0.22 |
4.093 ± 0.286 | 7.395 ± 0.245 |
Met |
Asn |
Gln |
Pro |
Arg |
Ser |
Thr |
Val |
Trp |
Tyr |
|---|---|---|---|---|---|---|---|---|---|
2.262 ± 0.105 | 3.11 ± 0.167 |
5.798 ± 0.201 | 3.166 ± 0.148 |
7.634 ± 0.329 | 5.255 ± 0.189 |
6.449 ± 0.225 | 7.105 ± 0.199 |
1.939 ± 0.116 | 2.571 ± 0.206 |
Most of the basic statistics you can see at this page can be downloaded from this CSV file
Proteome-pI is available under Creative Commons Attribution-NoDerivs license, for more details see here
| Reference: Kozlowski LP. Proteome-pI 2.0: Proteome Isoelectric Point Database Update. Nucleic Acids Res. 2021, doi: 10.1093/nar/gkab944 | Contact: Lukasz P. Kozlowski |
