Lactobacillus phage phiLdb
Taxonomy: Viruses; Duplodnaviria; Heunggongvirae; Uroviricota; Caudoviricetes; Caudovirales; Siphoviridae; Cequinquevirus; Lactobacillus virus phiLdb
Average proteome isoelectric point is 6.1
Get precalculated fractions of proteins

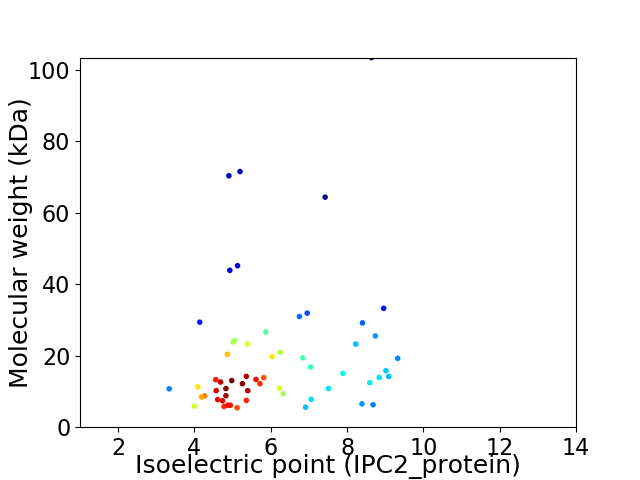
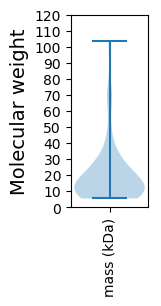
Virtual 2D-PAGE plot for 59 proteins (isoelectric point calculated using IPC2_protein)
Get csv file with sequences according to given criteria:
* You can choose from 21 different methods for calculating isoelectric point
Summary statistics related to proteome-wise predictions


Protein with the lowest isoelectric point:
>tr|U3PCR3|U3PCR3_9CAUD Putative ParB nuclease OS=Lactobacillus phage phiLdb OX=1399942 GN=phiLdb_0001 PE=4 SV=1
MM1 pKa = 7.34TKK3 pKa = 9.99IITAQKK9 pKa = 10.1IDD11 pKa = 3.74DD12 pKa = 4.31NNYY15 pKa = 9.81EE16 pKa = 4.26LYY18 pKa = 11.16LNGWLGDD25 pKa = 3.59QLYY28 pKa = 10.3EE29 pKa = 3.85DD30 pKa = 4.69TYY32 pKa = 11.45FGGLVFKK39 pKa = 10.84FGTWVLVQNTYY50 pKa = 10.76QGTNEE55 pKa = 4.2EE56 pKa = 4.19IDD58 pKa = 3.95YY59 pKa = 8.58QTDD62 pKa = 3.54DD63 pKa = 4.21LDD65 pKa = 4.01EE66 pKa = 4.3VLWTIDD72 pKa = 4.5CEE74 pKa = 5.79VMDD77 pKa = 5.11CDD79 pKa = 4.08NLEE82 pKa = 4.08VFNDD86 pKa = 3.86FLDD89 pKa = 4.02LQQ91 pKa = 4.07
MM1 pKa = 7.34TKK3 pKa = 9.99IITAQKK9 pKa = 10.1IDD11 pKa = 3.74DD12 pKa = 4.31NNYY15 pKa = 9.81EE16 pKa = 4.26LYY18 pKa = 11.16LNGWLGDD25 pKa = 3.59QLYY28 pKa = 10.3EE29 pKa = 3.85DD30 pKa = 4.69TYY32 pKa = 11.45FGGLVFKK39 pKa = 10.84FGTWVLVQNTYY50 pKa = 10.76QGTNEE55 pKa = 4.2EE56 pKa = 4.19IDD58 pKa = 3.95YY59 pKa = 8.58QTDD62 pKa = 3.54DD63 pKa = 4.21LDD65 pKa = 4.01EE66 pKa = 4.3VLWTIDD72 pKa = 4.5CEE74 pKa = 5.79VMDD77 pKa = 5.11CDD79 pKa = 4.08NLEE82 pKa = 4.08VFNDD86 pKa = 3.86FLDD89 pKa = 4.02LQQ91 pKa = 4.07
Molecular weight: 10.74 kDa
Isoelectric point according different methods:
Protein with the highest isoelectric point:
>tr|U3PDU2|U3PDU2_9CAUD Putative DNA replication protein OS=Lactobacillus phage phiLdb OX=1399942 GN=phiLdb_00039 PE=4 SV=1
MM1 pKa = 7.41KK2 pKa = 10.5FIIEE6 pKa = 4.04GRR8 pKa = 11.84LDD10 pKa = 3.57GLNTYY15 pKa = 9.14TGACRR20 pKa = 11.84ANRR23 pKa = 11.84YY24 pKa = 7.54GANAMKK30 pKa = 10.23RR31 pKa = 11.84KK32 pKa = 10.13NEE34 pKa = 3.81AKK36 pKa = 10.23VIEE39 pKa = 4.93GIKK42 pKa = 10.25RR43 pKa = 11.84AGLKK47 pKa = 10.1KK48 pKa = 10.27VEE50 pKa = 4.5EE51 pKa = 4.57YY52 pKa = 10.45PLTLHH57 pKa = 6.42IVWYY61 pKa = 9.28EE62 pKa = 3.58PNKK65 pKa = 10.52RR66 pKa = 11.84RR67 pKa = 11.84DD68 pKa = 3.02IDD70 pKa = 4.05NITFATKK77 pKa = 10.13FIQDD81 pKa = 3.86ALVKK85 pKa = 10.68SGILDD90 pKa = 4.32DD91 pKa = 5.85DD92 pKa = 3.88SQKK95 pKa = 11.2YY96 pKa = 9.12IVGLSHH102 pKa = 6.56QVTVDD107 pKa = 3.18RR108 pKa = 11.84KK109 pKa = 8.42NPRR112 pKa = 11.84IEE114 pKa = 3.9VEE116 pKa = 3.95LRR118 pKa = 11.84KK119 pKa = 10.27AEE121 pKa = 4.0
MM1 pKa = 7.41KK2 pKa = 10.5FIIEE6 pKa = 4.04GRR8 pKa = 11.84LDD10 pKa = 3.57GLNTYY15 pKa = 9.14TGACRR20 pKa = 11.84ANRR23 pKa = 11.84YY24 pKa = 7.54GANAMKK30 pKa = 10.23RR31 pKa = 11.84KK32 pKa = 10.13NEE34 pKa = 3.81AKK36 pKa = 10.23VIEE39 pKa = 4.93GIKK42 pKa = 10.25RR43 pKa = 11.84AGLKK47 pKa = 10.1KK48 pKa = 10.27VEE50 pKa = 4.5EE51 pKa = 4.57YY52 pKa = 10.45PLTLHH57 pKa = 6.42IVWYY61 pKa = 9.28EE62 pKa = 3.58PNKK65 pKa = 10.52RR66 pKa = 11.84RR67 pKa = 11.84DD68 pKa = 3.02IDD70 pKa = 4.05NITFATKK77 pKa = 10.13FIQDD81 pKa = 3.86ALVKK85 pKa = 10.68SGILDD90 pKa = 4.32DD91 pKa = 5.85DD92 pKa = 3.88SQKK95 pKa = 11.2YY96 pKa = 9.12IVGLSHH102 pKa = 6.56QVTVDD107 pKa = 3.18RR108 pKa = 11.84KK109 pKa = 8.42NPRR112 pKa = 11.84IEE114 pKa = 3.9VEE116 pKa = 3.95LRR118 pKa = 11.84KK119 pKa = 10.27AEE121 pKa = 4.0
Molecular weight: 13.91 kDa
Isoelectric point according different methods:
Peptides (in silico digests for buttom-up proteomics)
Below you can find in silico digests of the whole proteome with Trypsin, Chymotrypsin, Trypsin+LysC, LysN, ArgC proteases suitable for different mass spec machines.| Try ESI |
 |
|---|
| ChTry ESI |
 |
|---|
| ArgC ESI |
 |
|---|
| LysN ESI |
 |
|---|
| TryLysC ESI |
 |
|---|
| Try MALDI |
 |
|---|
| ChTry MALDI |
 |
|---|
| ArgC MALDI |
 |
|---|
| LysN MALDI |
 |
|---|
| TryLysC MALDI |
 |
|---|
| Try LTQ |
 |
|---|
| ChTry LTQ |
 |
|---|
| ArgC LTQ |
 |
|---|
| LysN LTQ |
 |
|---|
| TryLysC LTQ |
 |
|---|
| Try MSlow |
 |
|---|
| ChTry MSlow |
 |
|---|
| ArgC MSlow |
 |
|---|
| LysN MSlow |
 |
|---|
| TryLysC MSlow |
 |
|---|
| Try MShigh |
 |
|---|
| ChTry MShigh |
 |
|---|
| ArgC MShigh |
 |
|---|
| LysN MShigh |
 |
|---|
| TryLysC MShigh |
 |
|---|
General Statistics
Number of major isoforms |
Number of additional isoforms |
Number of all proteins |
Number of amino acids |
Min. Seq. Length |
Max. Seq. Length |
Avg. Seq. Length |
Avg. Mol. Weight |
|---|---|---|---|---|---|---|---|
0 |
10445 |
44 |
968 |
177.0 |
20.02 |
Amino acid frequency
Ala |
Cys |
Asp |
Glu |
Phe |
Gly |
His |
Ile |
Lys |
Leu |
|---|---|---|---|---|---|---|---|---|---|
6.625 ± 0.624 | 0.986 ± 0.145 |
6.932 ± 0.405 | 7.238 ± 0.494 |
3.791 ± 0.18 | 6.415 ± 0.346 |
1.379 ± 0.184 | 7.046 ± 0.289 |
8.722 ± 0.386 | 7.659 ± 0.226 |
Met |
Asn |
Gln |
Pro |
Arg |
Ser |
Thr |
Val |
Trp |
Tyr |
|---|---|---|---|---|---|---|---|---|---|
2.614 ± 0.181 | 6.596 ± 0.244 |
2.298 ± 0.144 | 3.293 ± 0.258 |
4.088 ± 0.256 | 6.242 ± 0.285 |
5.84 ± 0.314 | 6.778 ± 0.233 |
1.053 ± 0.106 | 4.404 ± 0.307 |
Most of the basic statistics you can see at this page can be downloaded from this CSV file
Proteome-pI is available under Creative Commons Attribution-NoDerivs license, for more details see here
| Reference: Kozlowski LP. Proteome-pI 2.0: Proteome Isoelectric Point Database Update. Nucleic Acids Res. 2021, doi: 10.1093/nar/gkab944 | Contact: Lukasz P. Kozlowski |
