Lactococcus phage phiL47
Taxonomy: Viruses; Duplodnaviria; Heunggongvirae; Uroviricota; Caudoviricetes; Caudovirales; Siphoviridae; Audreyjarvisvirus; Lactococcus virus phiL47
Average proteome isoelectric point is 5.91
Get precalculated fractions of proteins
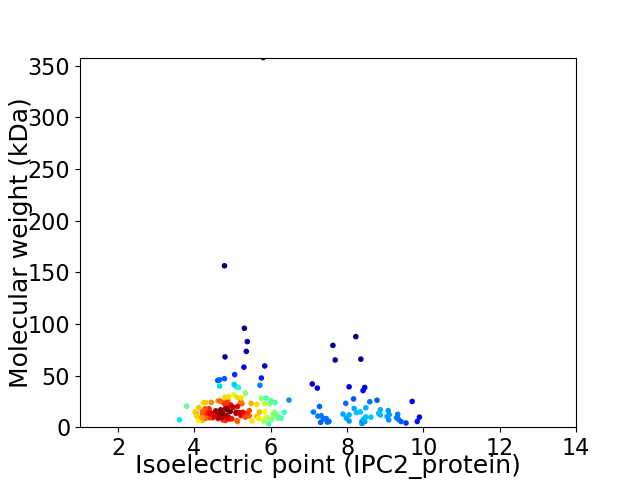
Virtual 2D-PAGE plot for 189 proteins (isoelectric point calculated using IPC2_protein)
Get csv file with sequences according to given criteria:
* You can choose from 21 different methods for calculating isoelectric point
Summary statistics related to proteome-wise predictions


Protein with the lowest isoelectric point:
>tr|V9VEQ4|V9VEQ4_9CAUD Uncharacterized protein OS=Lactococcus phage phiL47 OX=1412875 GN=T548_0035 PE=4 SV=1
MM1 pKa = 7.29KK2 pKa = 10.41VYY4 pKa = 10.92VLTADD9 pKa = 3.4TYY11 pKa = 10.57EE12 pKa = 4.4SYY14 pKa = 11.05GAQIEE19 pKa = 4.39LFGVFTTEE27 pKa = 3.39EE28 pKa = 4.2KK29 pKa = 10.64AEE31 pKa = 4.02KK32 pKa = 9.83RR33 pKa = 11.84ASEE36 pKa = 4.18MKK38 pKa = 10.28LDD40 pKa = 4.25CPDD43 pKa = 3.26ISVVNVDD50 pKa = 3.55EE51 pKa = 5.33NDD53 pKa = 3.37VQGYY57 pKa = 9.23LGGYY61 pKa = 9.2IEE63 pKa = 4.53
MM1 pKa = 7.29KK2 pKa = 10.41VYY4 pKa = 10.92VLTADD9 pKa = 3.4TYY11 pKa = 10.57EE12 pKa = 4.4SYY14 pKa = 11.05GAQIEE19 pKa = 4.39LFGVFTTEE27 pKa = 3.39EE28 pKa = 4.2KK29 pKa = 10.64AEE31 pKa = 4.02KK32 pKa = 9.83RR33 pKa = 11.84ASEE36 pKa = 4.18MKK38 pKa = 10.28LDD40 pKa = 4.25CPDD43 pKa = 3.26ISVVNVDD50 pKa = 3.55EE51 pKa = 5.33NDD53 pKa = 3.37VQGYY57 pKa = 9.23LGGYY61 pKa = 9.2IEE63 pKa = 4.53
Molecular weight: 7.07 kDa
Isoelectric point according different methods:
Protein with the highest isoelectric point:
>tr|V9VHX0|V9VHX0_9CAUD Uncharacterized protein OS=Lactococcus phage phiL47 OX=1412875 GN=T548_0064 PE=4 SV=1
MM1 pKa = 7.08FKK3 pKa = 10.67KK4 pKa = 10.48RR5 pKa = 11.84ITRR8 pKa = 11.84LITVIVSYY16 pKa = 11.05LLLIGTYY23 pKa = 9.12WIYY26 pKa = 8.9PTIHH30 pKa = 6.25MGNNIFKK37 pKa = 10.61NITILLIGQPILFMFLIAFNTFIIAFLVFIACVIIYY73 pKa = 9.35QIFTWIMKK81 pKa = 10.18GNN83 pKa = 3.54
MM1 pKa = 7.08FKK3 pKa = 10.67KK4 pKa = 10.48RR5 pKa = 11.84ITRR8 pKa = 11.84LITVIVSYY16 pKa = 11.05LLLIGTYY23 pKa = 9.12WIYY26 pKa = 8.9PTIHH30 pKa = 6.25MGNNIFKK37 pKa = 10.61NITILLIGQPILFMFLIAFNTFIIAFLVFIACVIIYY73 pKa = 9.35QIFTWIMKK81 pKa = 10.18GNN83 pKa = 3.54
Molecular weight: 9.78 kDa
Isoelectric point according different methods:
Peptides (in silico digests for buttom-up proteomics)
Below you can find in silico digests of the whole proteome with Trypsin, Chymotrypsin, Trypsin+LysC, LysN, ArgC proteases suitable for different mass spec machines.| Try ESI |
 |
|---|
| ChTry ESI |
|
|---|
| ArgC ESI |
|
|---|
| LysN ESI |
|
|---|
| TryLysC ESI |
|
|---|
| Try MALDI |
|
|---|
| ChTry MALDI |
|
|---|
| ArgC MALDI |
|
|---|
| LysN MALDI |
|
|---|
| TryLysC MALDI |
|
|---|
| Try LTQ |
|
|---|
| ChTry LTQ |
|
|---|
| ArgC LTQ |
|
|---|
| LysN LTQ |
|
|---|
| TryLysC LTQ |
|
|---|
| Try MSlow |
|
|---|
| ChTry MSlow |
|
|---|
| ArgC MSlow |
|
|---|
| LysN MSlow |
|
|---|
| TryLysC MSlow |
|
|---|
| Try MShigh |
|
|---|
| ChTry MShigh |
|
|---|
| ArgC MShigh |
|
|---|
| LysN MShigh |
|
|---|
| TryLysC MShigh |
|
|---|
General Statistics
Number of major isoforms |
Number of additional isoforms |
Number of all proteins |
Number of amino acids |
Min. Seq. Length |
Max. Seq. Length |
Avg. Seq. Length |
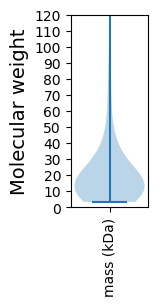
Avg. Mol. Weight |
|---|---|---|---|---|---|---|---|
0 |
36423 |
29 |
3275 |
192.7 |
22.06 |
Amino acid frequency
Ala |
Cys |
Asp |
Glu |
Phe |
Gly |
His |
Ile |
Lys |
Leu |
|---|---|---|---|---|---|---|---|---|---|
4.884 ± 0.334 | 0.615 ± 0.082 |
6.902 ± 0.175 | 8.135 ± 0.293 |
4.478 ± 0.245 | 5.768 ± 0.214 |
1.34 ± 0.1 | 7.72 ± 0.177 |
9.027 ± 0.164 | 8.237 ± 0.173 |
Met |
Asn |
Gln |
Pro |
Arg |
Ser |
Thr |
Val |
Trp |
Tyr |
|---|---|---|---|---|---|---|---|---|---|
2.682 ± 0.104 | 6.455 ± 0.185 |
2.227 ± 0.104 | 3.3 ± 0.311 |
3.476 ± 0.147 | 6.625 ± 0.261 |
6.227 ± 0.212 | 6.221 ± 0.166 |
1.093 ± 0.088 | 4.588 ± 0.206 |
Most of the basic statistics you can see at this page can be downloaded from this CSV file
See this proteome in:

Proteome-pI is available under Creative Commons Attribution-NoDerivs license, for more details see here
| Reference: Kozlowski LP. Proteome-pI 2.0: Proteome Isoelectric Point Database Update. Nucleic Acids Res. 2021, doi: 10.1093/nar/gkab944 | Contact: Lukasz P. Kozlowski |