Escherichia phage EcSzw_1
Taxonomy: Viruses; Duplodnaviria; Heunggongvirae; Uroviricota; Caudoviricetes; Caudovirales; Myoviridae; Ounavirinae; Suspvirus; unclassified Suspvirus
Average proteome isoelectric point is 6.35
Get precalculated fractions of proteins

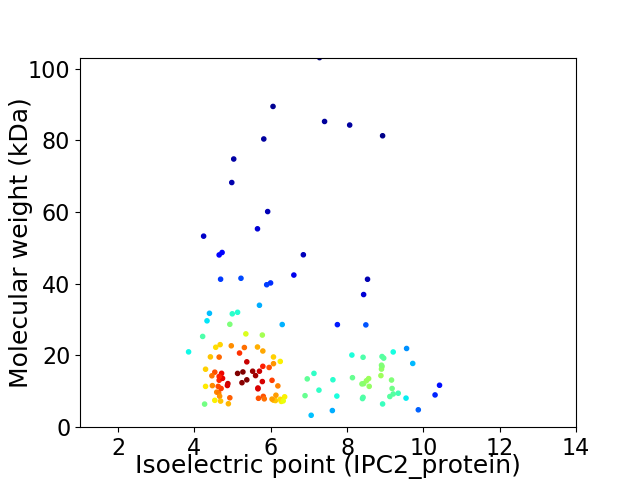
Virtual 2D-PAGE plot for 130 proteins (isoelectric point calculated using IPC2_protein)
Get csv file with sequences according to given criteria:
* You can choose from 21 different methods for calculating isoelectric point
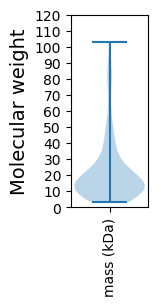
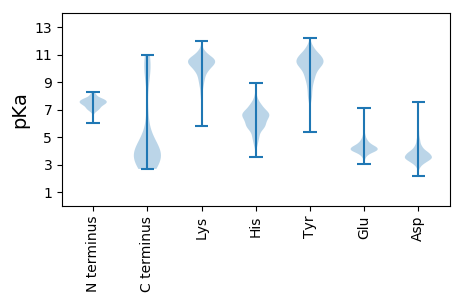
Summary statistics related to proteome-wise predictions


Protein with the lowest isoelectric point:
>tr|A0A411BGX5|A0A411BGX5_9CAUD Uncharacterized protein OS=Escherichia phage EcSzw_1 OX=2419742 GN=EcSzw1_3 PE=4 SV=1
MM1 pKa = 7.47KK2 pKa = 9.8CFHH5 pKa = 6.61GTTQEE10 pKa = 3.94NFVNLINGGDD20 pKa = 3.8KK21 pKa = 10.83PSGAWNCSDD30 pKa = 4.52SDD32 pKa = 3.86GCFYY36 pKa = 11.09VYY38 pKa = 10.13PVNKK42 pKa = 10.0FYY44 pKa = 11.24DD45 pKa = 4.3LDD47 pKa = 3.88SMNAEE52 pKa = 4.39EE53 pKa = 4.51ITNEE57 pKa = 3.97GLRR60 pKa = 11.84NALDD64 pKa = 3.6SATITAAFQMKK75 pKa = 7.87TQNIVILEE83 pKa = 4.05LDD85 pKa = 3.19IPEE88 pKa = 5.18YY89 pKa = 10.5EE90 pKa = 4.74LQDD93 pKa = 3.54DD94 pKa = 4.64WSCEE98 pKa = 3.87NMSDD102 pKa = 2.97IASFTEE108 pKa = 4.54SFDD111 pKa = 3.62KK112 pKa = 11.01DD113 pKa = 3.61WIKK116 pKa = 10.82KK117 pKa = 9.6VYY119 pKa = 8.44ITEE122 pKa = 4.2FNSMYY127 pKa = 10.9SPFFVPNLKK136 pKa = 10.21NPNLGYY142 pKa = 10.38VDD144 pKa = 4.01EE145 pKa = 4.92KK146 pKa = 11.24LEE148 pKa = 4.09EE149 pKa = 4.11VASFIQNTDD158 pKa = 3.18DD159 pKa = 5.45SSIIYY164 pKa = 10.47CNMLDD169 pKa = 4.55AMQEE173 pKa = 4.18SLTEE177 pKa = 4.06STVNDD182 pKa = 3.45VLAA185 pKa = 4.9
MM1 pKa = 7.47KK2 pKa = 9.8CFHH5 pKa = 6.61GTTQEE10 pKa = 3.94NFVNLINGGDD20 pKa = 3.8KK21 pKa = 10.83PSGAWNCSDD30 pKa = 4.52SDD32 pKa = 3.86GCFYY36 pKa = 11.09VYY38 pKa = 10.13PVNKK42 pKa = 10.0FYY44 pKa = 11.24DD45 pKa = 4.3LDD47 pKa = 3.88SMNAEE52 pKa = 4.39EE53 pKa = 4.51ITNEE57 pKa = 3.97GLRR60 pKa = 11.84NALDD64 pKa = 3.6SATITAAFQMKK75 pKa = 7.87TQNIVILEE83 pKa = 4.05LDD85 pKa = 3.19IPEE88 pKa = 5.18YY89 pKa = 10.5EE90 pKa = 4.74LQDD93 pKa = 3.54DD94 pKa = 4.64WSCEE98 pKa = 3.87NMSDD102 pKa = 2.97IASFTEE108 pKa = 4.54SFDD111 pKa = 3.62KK112 pKa = 11.01DD113 pKa = 3.61WIKK116 pKa = 10.82KK117 pKa = 9.6VYY119 pKa = 8.44ITEE122 pKa = 4.2FNSMYY127 pKa = 10.9SPFFVPNLKK136 pKa = 10.21NPNLGYY142 pKa = 10.38VDD144 pKa = 4.01EE145 pKa = 4.92KK146 pKa = 11.24LEE148 pKa = 4.09EE149 pKa = 4.11VASFIQNTDD158 pKa = 3.18DD159 pKa = 5.45SSIIYY164 pKa = 10.47CNMLDD169 pKa = 4.55AMQEE173 pKa = 4.18SLTEE177 pKa = 4.06STVNDD182 pKa = 3.45VLAA185 pKa = 4.9
Molecular weight: 21.0 kDa
Isoelectric point according different methods:
Protein with the highest isoelectric point:
>tr|A0A411BH11|A0A411BH11_9CAUD Ribonucleoside-diphosphate reductase OS=Escherichia phage EcSzw_1 OX=2419742 GN=EcSzw1_45 PE=3 SV=1
MM1 pKa = 7.71GIFSGMKK8 pKa = 9.73SRR10 pKa = 11.84MLAALAKK17 pKa = 8.7VAAVIATTGKK27 pKa = 10.39DD28 pKa = 2.93AGIDD32 pKa = 3.17IKK34 pKa = 10.34TVTDD38 pKa = 4.37SINAQTLAQPYY49 pKa = 9.33IYY51 pKa = 10.27VGRR54 pKa = 11.84GKK56 pKa = 10.59GGKK59 pKa = 8.68KK60 pKa = 8.45QAHH63 pKa = 5.92RR64 pKa = 11.84QTGAAAIKK72 pKa = 10.1RR73 pKa = 11.84AAKK76 pKa = 9.87KK77 pKa = 10.13ARR79 pKa = 11.84NRR81 pKa = 11.84KK82 pKa = 8.79RR83 pKa = 11.84NKK85 pKa = 9.84
MM1 pKa = 7.71GIFSGMKK8 pKa = 9.73SRR10 pKa = 11.84MLAALAKK17 pKa = 8.7VAAVIATTGKK27 pKa = 10.39DD28 pKa = 2.93AGIDD32 pKa = 3.17IKK34 pKa = 10.34TVTDD38 pKa = 4.37SINAQTLAQPYY49 pKa = 9.33IYY51 pKa = 10.27VGRR54 pKa = 11.84GKK56 pKa = 10.59GGKK59 pKa = 8.68KK60 pKa = 8.45QAHH63 pKa = 5.92RR64 pKa = 11.84QTGAAAIKK72 pKa = 10.1RR73 pKa = 11.84AAKK76 pKa = 9.87KK77 pKa = 10.13ARR79 pKa = 11.84NRR81 pKa = 11.84KK82 pKa = 8.79RR83 pKa = 11.84NKK85 pKa = 9.84
Molecular weight: 9.0 kDa
Isoelectric point according different methods:
Peptides (in silico digests for buttom-up proteomics)
Below you can find in silico digests of the whole proteome with Trypsin, Chymotrypsin, Trypsin+LysC, LysN, ArgC proteases suitable for different mass spec machines.| Try ESI |
 |
|---|
| ChTry ESI |
 |
|---|
| ArgC ESI |
 |
|---|
| LysN ESI |
 |
|---|
| TryLysC ESI |
 |
|---|
| Try MALDI |
 |
|---|
| ChTry MALDI |
 |
|---|
| ArgC MALDI |
 |
|---|
| LysN MALDI |
 |
|---|
| TryLysC MALDI |
 |
|---|
| Try LTQ |
 |
|---|
| ChTry LTQ |
 |
|---|
| ArgC LTQ |
 |
|---|
| LysN LTQ |
 |
|---|
| TryLysC LTQ |
 |
|---|
| Try MSlow |
 |
|---|
| ChTry MSlow |
 |
|---|
| ArgC MSlow |
 |
|---|
| LysN MSlow |
 |
|---|
| TryLysC MSlow |
 |
|---|
| Try MShigh |
 |
|---|
| ChTry MShigh |
 |
|---|
| ArgC MShigh |
 |
|---|
| LysN MShigh |
 |
|---|
| TryLysC MShigh |
 |
|---|
General Statistics
Number of major isoforms |
Number of additional isoforms |
Number of all proteins |
Number of amino acids |
Min. Seq. Length |
Max. Seq. Length |
Avg. Seq. Length |
Avg. Mol. Weight |
|---|---|---|---|---|---|---|---|
0 |
25585 |
29 |
899 |
196.8 |
22.18 |
Amino acid frequency
Ala |
Cys |
Asp |
Glu |
Phe |
Gly |
His |
Ile |
Lys |
Leu |
|---|---|---|---|---|---|---|---|---|---|
7.379 ± 0.279 | 1.305 ± 0.106 |
6.301 ± 0.186 | 6.695 ± 0.272 |
4.284 ± 0.149 | 6.586 ± 0.22 |
2.052 ± 0.138 | 5.867 ± 0.161 |
7.727 ± 0.275 | 7.915 ± 0.161 |
Met |
Asn |
Gln |
Pro |
Arg |
Ser |
Thr |
Val |
Trp |
Tyr |
|---|---|---|---|---|---|---|---|---|---|
2.92 ± 0.13 | 5.089 ± 0.191 |
2.951 ± 0.116 | 3.58 ± 0.155 |
4.174 ± 0.135 | 6.261 ± 0.21 |
6.328 ± 0.319 | 7.008 ± 0.184 |
1.223 ± 0.095 | 4.331 ± 0.17 |
Most of the basic statistics you can see at this page can be downloaded from this CSV file
Proteome-pI is available under Creative Commons Attribution-NoDerivs license, for more details see here
| Reference: Kozlowski LP. Proteome-pI 2.0: Proteome Isoelectric Point Database Update. Nucleic Acids Res. 2021, doi: 10.1093/nar/gkab944 | Contact: Lukasz P. Kozlowski |
