Tortoise microvirus 75
Taxonomy: Viruses; Monodnaviria; Sangervirae; Phixviricota; Malgrandaviricetes; Petitvirales; Microviridae; unclassified Microviridae
Average proteome isoelectric point is 7.33
Get precalculated fractions of proteins

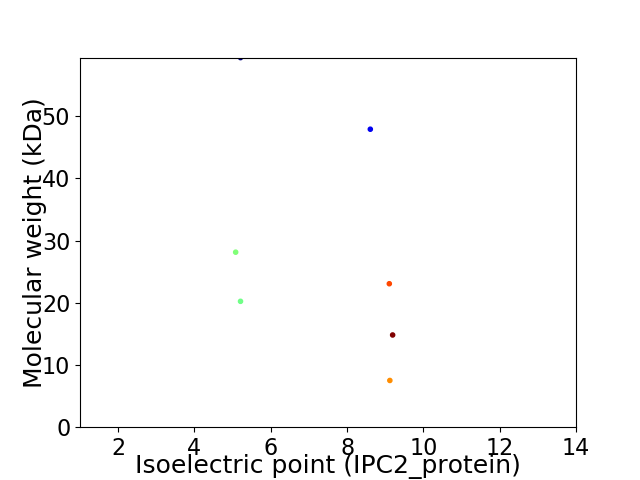
Virtual 2D-PAGE plot for 7 proteins (isoelectric point calculated using IPC2_protein)
Get csv file with sequences according to given criteria:
* You can choose from 21 different methods for calculating isoelectric point
Summary statistics related to proteome-wise predictions


Protein with the lowest isoelectric point:
>tr|A0A4P8WA06|A0A4P8WA06_9VIRU Peptidase_M15_4 domain-containing protein OS=Tortoise microvirus 75 OX=2583182 PE=4 SV=1
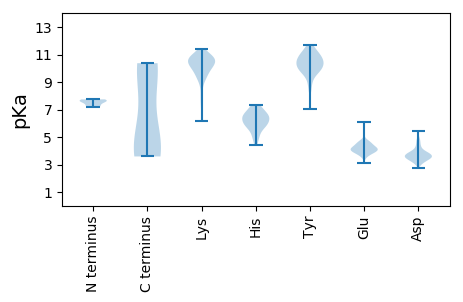
MM1 pKa = 7.61GEE3 pKa = 3.9GSAALAEE10 pKa = 4.26MASTGIGTRR19 pKa = 11.84VIHH22 pKa = 6.88DD23 pKa = 3.77ANGVVGLQFTSPVQEE38 pKa = 4.59ASSQGSPSRR47 pKa = 11.84ATEE50 pKa = 4.04PGNVGAVEE58 pKa = 4.07RR59 pKa = 11.84RR60 pKa = 11.84QEE62 pKa = 3.8AGVIRR67 pKa = 11.84EE68 pKa = 3.93TAYY71 pKa = 10.75GSVAGDD77 pKa = 3.61ALAGARR83 pKa = 11.84QEE85 pKa = 3.96ATLEE89 pKa = 3.95NRR91 pKa = 11.84GAKK94 pKa = 10.05APALKK99 pKa = 9.3STASSRR105 pKa = 11.84GAFVASFVRR114 pKa = 11.84DD115 pKa = 3.36WNFSGKK121 pKa = 9.82DD122 pKa = 3.46DD123 pKa = 4.34PVQDD127 pKa = 3.43MVFAGTHH134 pKa = 4.45WAANPKK140 pKa = 8.2FTNGDD145 pKa = 3.77LVQTRR150 pKa = 11.84YY151 pKa = 10.44GDD153 pKa = 3.68SEE155 pKa = 4.14IVQEE159 pKa = 4.38VVGLSILGADD169 pKa = 3.28IGFNAARR176 pKa = 11.84AVFGPNVQNMGPQARR191 pKa = 11.84LDD193 pKa = 3.71ALGAMAGKK201 pKa = 9.6GAHH204 pKa = 6.08SAIQGAIDD212 pKa = 3.12TGFNLGDD219 pKa = 3.74AVRR222 pKa = 11.84EE223 pKa = 3.75AAAQNKK229 pKa = 8.02LHH231 pKa = 6.14EE232 pKa = 4.5EE233 pKa = 4.33RR234 pKa = 11.84YY235 pKa = 9.81NAAKK239 pKa = 10.55DD240 pKa = 3.73AFNEE244 pKa = 3.91AWDD247 pKa = 3.9YY248 pKa = 11.38RR249 pKa = 11.84EE250 pKa = 4.18KK251 pKa = 10.91LQEE254 pKa = 3.92QEE256 pKa = 4.38AVRR259 pKa = 11.84QQGGNIGGFFF269 pKa = 3.59
MM1 pKa = 7.61GEE3 pKa = 3.9GSAALAEE10 pKa = 4.26MASTGIGTRR19 pKa = 11.84VIHH22 pKa = 6.88DD23 pKa = 3.77ANGVVGLQFTSPVQEE38 pKa = 4.59ASSQGSPSRR47 pKa = 11.84ATEE50 pKa = 4.04PGNVGAVEE58 pKa = 4.07RR59 pKa = 11.84RR60 pKa = 11.84QEE62 pKa = 3.8AGVIRR67 pKa = 11.84EE68 pKa = 3.93TAYY71 pKa = 10.75GSVAGDD77 pKa = 3.61ALAGARR83 pKa = 11.84QEE85 pKa = 3.96ATLEE89 pKa = 3.95NRR91 pKa = 11.84GAKK94 pKa = 10.05APALKK99 pKa = 9.3STASSRR105 pKa = 11.84GAFVASFVRR114 pKa = 11.84DD115 pKa = 3.36WNFSGKK121 pKa = 9.82DD122 pKa = 3.46DD123 pKa = 4.34PVQDD127 pKa = 3.43MVFAGTHH134 pKa = 4.45WAANPKK140 pKa = 8.2FTNGDD145 pKa = 3.77LVQTRR150 pKa = 11.84YY151 pKa = 10.44GDD153 pKa = 3.68SEE155 pKa = 4.14IVQEE159 pKa = 4.38VVGLSILGADD169 pKa = 3.28IGFNAARR176 pKa = 11.84AVFGPNVQNMGPQARR191 pKa = 11.84LDD193 pKa = 3.71ALGAMAGKK201 pKa = 9.6GAHH204 pKa = 6.08SAIQGAIDD212 pKa = 3.12TGFNLGDD219 pKa = 3.74AVRR222 pKa = 11.84EE223 pKa = 3.75AAAQNKK229 pKa = 8.02LHH231 pKa = 6.14EE232 pKa = 4.5EE233 pKa = 4.33RR234 pKa = 11.84YY235 pKa = 9.81NAAKK239 pKa = 10.55DD240 pKa = 3.73AFNEE244 pKa = 3.91AWDD247 pKa = 3.9YY248 pKa = 11.38RR249 pKa = 11.84EE250 pKa = 4.18KK251 pKa = 10.91LQEE254 pKa = 3.92QEE256 pKa = 4.38AVRR259 pKa = 11.84QQGGNIGGFFF269 pKa = 3.59
Molecular weight: 28.13 kDa
Isoelectric point according different methods:
Protein with the highest isoelectric point:
>tr|A0A4P8WA59|A0A4P8WA59_9VIRU Replication initiation protein OS=Tortoise microvirus 75 OX=2583182 PE=4 SV=1
MM1 pKa = 7.65AKK3 pKa = 10.14HH4 pKa = 5.79SPKK7 pKa = 10.05NQVYY11 pKa = 10.26SKK13 pKa = 9.28PPKK16 pKa = 10.1GGFVYY21 pKa = 10.39EE22 pKa = 4.23PEE24 pKa = 4.1EE25 pKa = 4.33VFPGDD30 pKa = 3.71YY31 pKa = 10.1QEE33 pKa = 4.67HH34 pKa = 5.83EE35 pKa = 4.53NYY37 pKa = 10.11RR38 pKa = 11.84EE39 pKa = 3.99ALRR42 pKa = 11.84EE43 pKa = 4.03LKK45 pKa = 10.59DD46 pKa = 3.36PAMLRR51 pKa = 11.84SKK53 pKa = 10.43KK54 pKa = 9.59YY55 pKa = 10.21QEE57 pKa = 4.16QQWRR61 pKa = 11.84AIRR64 pKa = 11.84IGANPQLLLHH74 pKa = 6.1MRR76 pKa = 11.84LMVARR81 pKa = 11.84FKK83 pKa = 11.07QVGIPVFPSEE93 pKa = 3.87IVRR96 pKa = 11.84SHH98 pKa = 5.8EE99 pKa = 3.99RR100 pKa = 11.84QNQLKK105 pKa = 10.58ADD107 pKa = 4.13GFSKK111 pKa = 10.9ASGAKK116 pKa = 9.5APHH119 pKa = 7.26PYY121 pKa = 9.77GCAYY125 pKa = 10.66DD126 pKa = 4.61LVHH129 pKa = 7.21SVRR132 pKa = 11.84GWNLSKK138 pKa = 10.77KK139 pKa = 6.86QWEE142 pKa = 4.6VFGHH146 pKa = 5.28VGKK149 pKa = 10.45EE150 pKa = 3.49LAIQRR155 pKa = 11.84NIPMIWGGDD164 pKa = 3.09WKK166 pKa = 10.83FYY168 pKa = 11.39DD169 pKa = 3.92PAHH172 pKa = 6.02WQLKK176 pKa = 6.16EE177 pKa = 3.54WRR179 pKa = 11.84QIMTDD184 pKa = 4.06YY185 pKa = 10.42PWPPANKK192 pKa = 10.17GIAHH196 pKa = 7.3RR197 pKa = 4.51
MM1 pKa = 7.65AKK3 pKa = 10.14HH4 pKa = 5.79SPKK7 pKa = 10.05NQVYY11 pKa = 10.26SKK13 pKa = 9.28PPKK16 pKa = 10.1GGFVYY21 pKa = 10.39EE22 pKa = 4.23PEE24 pKa = 4.1EE25 pKa = 4.33VFPGDD30 pKa = 3.71YY31 pKa = 10.1QEE33 pKa = 4.67HH34 pKa = 5.83EE35 pKa = 4.53NYY37 pKa = 10.11RR38 pKa = 11.84EE39 pKa = 3.99ALRR42 pKa = 11.84EE43 pKa = 4.03LKK45 pKa = 10.59DD46 pKa = 3.36PAMLRR51 pKa = 11.84SKK53 pKa = 10.43KK54 pKa = 9.59YY55 pKa = 10.21QEE57 pKa = 4.16QQWRR61 pKa = 11.84AIRR64 pKa = 11.84IGANPQLLLHH74 pKa = 6.1MRR76 pKa = 11.84LMVARR81 pKa = 11.84FKK83 pKa = 11.07QVGIPVFPSEE93 pKa = 3.87IVRR96 pKa = 11.84SHH98 pKa = 5.8EE99 pKa = 3.99RR100 pKa = 11.84QNQLKK105 pKa = 10.58ADD107 pKa = 4.13GFSKK111 pKa = 10.9ASGAKK116 pKa = 9.5APHH119 pKa = 7.26PYY121 pKa = 9.77GCAYY125 pKa = 10.66DD126 pKa = 4.61LVHH129 pKa = 7.21SVRR132 pKa = 11.84GWNLSKK138 pKa = 10.77KK139 pKa = 6.86QWEE142 pKa = 4.6VFGHH146 pKa = 5.28VGKK149 pKa = 10.45EE150 pKa = 3.49LAIQRR155 pKa = 11.84NIPMIWGGDD164 pKa = 3.09WKK166 pKa = 10.83FYY168 pKa = 11.39DD169 pKa = 3.92PAHH172 pKa = 6.02WQLKK176 pKa = 6.16EE177 pKa = 3.54WRR179 pKa = 11.84QIMTDD184 pKa = 4.06YY185 pKa = 10.42PWPPANKK192 pKa = 10.17GIAHH196 pKa = 7.3RR197 pKa = 4.51
Molecular weight: 23.06 kDa
Isoelectric point according different methods:
Peptides (in silico digests for buttom-up proteomics)
Below you can find in silico digests of the whole proteome with Trypsin, Chymotrypsin, Trypsin+LysC, LysN, ArgC proteases suitable for different mass spec machines.| Try ESI |
 |
|---|
| ChTry ESI |
 |
|---|
| ArgC ESI |
 |
|---|
| LysN ESI |
 |
|---|
| TryLysC ESI |
 |
|---|
| Try MALDI |
 |
|---|
| ChTry MALDI |
 |
|---|
| ArgC MALDI |
 |
|---|
| LysN MALDI |
 |
|---|
| TryLysC MALDI |
 |
|---|
| Try LTQ |
 |
|---|
| ChTry LTQ |
 |
|---|
| ArgC LTQ |
 |
|---|
| LysN LTQ |
 |
|---|
| TryLysC LTQ |
 |
|---|
| Try MSlow |
 |
|---|
| ChTry MSlow |
 |
|---|
| ArgC MSlow |
 |
|---|
| LysN MSlow |
 |
|---|
| TryLysC MSlow |
 |
|---|
| Try MShigh |
 |
|---|
| ChTry MShigh |
 |
|---|
| ArgC MShigh |
 |
|---|
| LysN MShigh |
 |
|---|
| TryLysC MShigh |
 |
|---|
General Statistics
Number of major isoforms |
Number of additional isoforms |
Number of all proteins |
Number of amino acids |
Min. Seq. Length |
Max. Seq. Length |
Avg. Seq. Length |
Avg. Mol. Weight |
|---|---|---|---|---|---|---|---|
0 |
1817 |
68 |
545 |
259.6 |
28.72 |
Amino acid frequency
Ala |
Cys |
Asp |
Glu |
Phe |
Gly |
His |
Ile |
Lys |
Leu |
|---|---|---|---|---|---|---|---|---|---|
11.062 ± 0.981 | 0.495 ± 0.183 |
4.953 ± 0.468 | 6.824 ± 0.992 |
3.467 ± 0.243 | 8.586 ± 1.221 |
2.422 ± 0.448 | 3.357 ± 0.348 |
4.898 ± 0.876 | 6.604 ± 0.898 |
Met |
Asn |
Gln |
Pro |
Arg |
Ser |
Thr |
Val |
Trp |
Tyr |
|---|---|---|---|---|---|---|---|---|---|
2.807 ± 0.372 | 3.797 ± 0.565 |
5.779 ± 0.93 | 4.678 ± 0.535 |
7.1 ± 0.717 | 5.944 ± 0.581 |
4.348 ± 0.901 | 7.76 ± 0.838 |
2.146 ± 0.409 | 2.972 ± 0.508 |
Most of the basic statistics you can see at this page can be downloaded from this CSV file
Proteome-pI is available under Creative Commons Attribution-NoDerivs license, for more details see here
| Reference: Kozlowski LP. Proteome-pI 2.0: Proteome Isoelectric Point Database Update. Nucleic Acids Res. 2021, doi: 10.1093/nar/gkab944 | Contact: Lukasz P. Kozlowski |
