Sediminibacterium ginsengisoli
Taxonomy: cellular organisms; Bacteria; FCB group; Bacteroidetes/Chlorobi group; Bacteroidetes; Chitinophagia; Chitinophagales; Chitinophagaceae; Sediminibacterium
Average proteome isoelectric point is 7.06
Get precalculated fractions of proteins

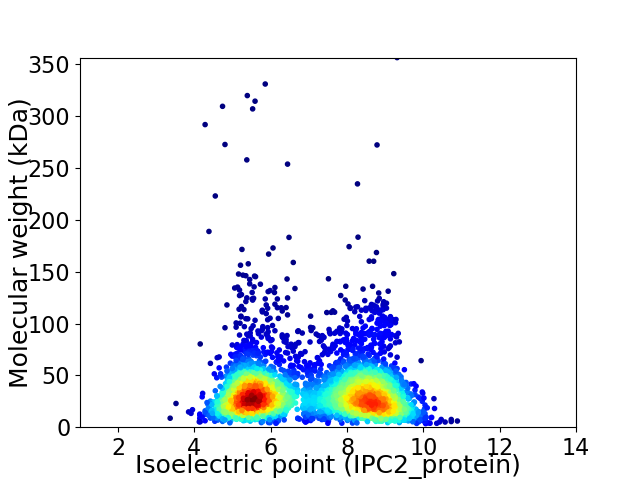
Virtual 2D-PAGE plot for 3581 proteins (isoelectric point calculated using IPC2_protein)
Get csv file with sequences according to given criteria:
* You can choose from 21 different methods for calculating isoelectric point
Summary statistics related to proteome-wise predictions


Protein with the lowest isoelectric point:
>tr|A0A1T4LGF0|A0A1T4LGF0_9BACT Uncharacterized membrane protein YgdD TMEM256/DUF423 family OS=Sediminibacterium ginsengisoli OX=413434 GN=SAMN04488132_102486 PE=3 SV=1
MM1 pKa = 7.73WIVLYY6 pKa = 10.94LGTNRR11 pKa = 11.84NFMQPQPLIEE21 pKa = 4.74LNSSGAAVIAWQLFLQKK38 pKa = 10.48NGYY41 pKa = 8.54NVSTADD47 pKa = 3.97GNFGPQTQAATMAFQTKK64 pKa = 10.4NGLTADD70 pKa = 3.97GVVGPGTYY78 pKa = 8.78TVAEE82 pKa = 4.11QQGFTGTAVQMADD95 pKa = 3.33FVGIDD100 pKa = 3.38VAHH103 pKa = 6.72YY104 pKa = 10.41DD105 pKa = 4.13SNDD108 pKa = 3.2GANPINWEE116 pKa = 4.23LVKK119 pKa = 10.37QDD121 pKa = 3.41PQNIKK126 pKa = 10.39FVFVKK131 pKa = 10.02ATDD134 pKa = 3.88GASGPNSVDD143 pKa = 2.89QTFATNVAGAGAVGLPVGAYY163 pKa = 9.42HH164 pKa = 7.46FYY166 pKa = 10.89EE167 pKa = 4.92LGSAATAQASNFITNTGNHH186 pKa = 5.81QLLTLPPVLDD196 pKa = 3.97FEE198 pKa = 5.29LPVAASAIQQTMDD211 pKa = 6.18DD212 pKa = 3.55INTWLEE218 pKa = 3.93QVEE221 pKa = 4.41KK222 pKa = 10.99AFGKK226 pKa = 8.79TPIIYY231 pKa = 7.81TNPNAWDD238 pKa = 3.59ALGNPSGFSKK248 pKa = 10.89YY249 pKa = 9.76PLWIADD255 pKa = 4.09YY256 pKa = 9.71NSSIAPPVLGSWPQWAFWQFTEE278 pKa = 4.17TGTVQGIVNPASMDD292 pKa = 3.3INHH295 pKa = 6.35YY296 pKa = 10.27NPASGILAVV305 pKa = 3.98
MM1 pKa = 7.73WIVLYY6 pKa = 10.94LGTNRR11 pKa = 11.84NFMQPQPLIEE21 pKa = 4.74LNSSGAAVIAWQLFLQKK38 pKa = 10.48NGYY41 pKa = 8.54NVSTADD47 pKa = 3.97GNFGPQTQAATMAFQTKK64 pKa = 10.4NGLTADD70 pKa = 3.97GVVGPGTYY78 pKa = 8.78TVAEE82 pKa = 4.11QQGFTGTAVQMADD95 pKa = 3.33FVGIDD100 pKa = 3.38VAHH103 pKa = 6.72YY104 pKa = 10.41DD105 pKa = 4.13SNDD108 pKa = 3.2GANPINWEE116 pKa = 4.23LVKK119 pKa = 10.37QDD121 pKa = 3.41PQNIKK126 pKa = 10.39FVFVKK131 pKa = 10.02ATDD134 pKa = 3.88GASGPNSVDD143 pKa = 2.89QTFATNVAGAGAVGLPVGAYY163 pKa = 9.42HH164 pKa = 7.46FYY166 pKa = 10.89EE167 pKa = 4.92LGSAATAQASNFITNTGNHH186 pKa = 5.81QLLTLPPVLDD196 pKa = 3.97FEE198 pKa = 5.29LPVAASAIQQTMDD211 pKa = 6.18DD212 pKa = 3.55INTWLEE218 pKa = 3.93QVEE221 pKa = 4.41KK222 pKa = 10.99AFGKK226 pKa = 8.79TPIIYY231 pKa = 7.81TNPNAWDD238 pKa = 3.59ALGNPSGFSKK248 pKa = 10.89YY249 pKa = 9.76PLWIADD255 pKa = 4.09YY256 pKa = 9.71NSSIAPPVLGSWPQWAFWQFTEE278 pKa = 4.17TGTVQGIVNPASMDD292 pKa = 3.3INHH295 pKa = 6.35YY296 pKa = 10.27NPASGILAVV305 pKa = 3.98
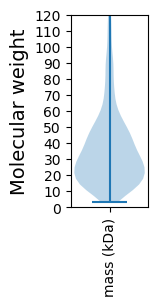
Molecular weight: 32.66 kDa
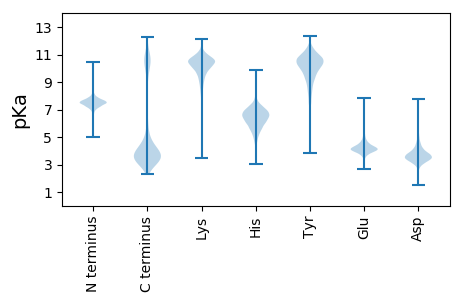
Isoelectric point according different methods:
Protein with the highest isoelectric point:
>tr|A0A1T4M5K7|A0A1T4M5K7_9BACT Gliding motility-associated protein GldC OS=Sediminibacterium ginsengisoli OX=413434 GN=SAMN04488132_103169 PE=4 SV=1
MM1 pKa = 7.38KK2 pKa = 9.59RR3 pKa = 11.84TFQPHH8 pKa = 4.67KK9 pKa = 9.7RR10 pKa = 11.84RR11 pKa = 11.84RR12 pKa = 11.84KK13 pKa = 8.4SVHH16 pKa = 4.97GFRR19 pKa = 11.84KK20 pKa = 10.08RR21 pKa = 11.84MATANGRR28 pKa = 11.84KK29 pKa = 9.14VLASRR34 pKa = 11.84RR35 pKa = 11.84AKK37 pKa = 10.04GRR39 pKa = 11.84KK40 pKa = 8.7KK41 pKa = 10.08LTVSSEE47 pKa = 4.1KK48 pKa = 10.7GLKK51 pKa = 9.34
MM1 pKa = 7.38KK2 pKa = 9.59RR3 pKa = 11.84TFQPHH8 pKa = 4.67KK9 pKa = 9.7RR10 pKa = 11.84RR11 pKa = 11.84RR12 pKa = 11.84KK13 pKa = 8.4SVHH16 pKa = 4.97GFRR19 pKa = 11.84KK20 pKa = 10.08RR21 pKa = 11.84MATANGRR28 pKa = 11.84KK29 pKa = 9.14VLASRR34 pKa = 11.84RR35 pKa = 11.84AKK37 pKa = 10.04GRR39 pKa = 11.84KK40 pKa = 8.7KK41 pKa = 10.08LTVSSEE47 pKa = 4.1KK48 pKa = 10.7GLKK51 pKa = 9.34
Molecular weight: 5.96 kDa
Isoelectric point according different methods:
Peptides (in silico digests for buttom-up proteomics)
Below you can find in silico digests of the whole proteome with Trypsin, Chymotrypsin, Trypsin+LysC, LysN, ArgC proteases suitable for different mass spec machines.| Try ESI |
 |
|---|
| ChTry ESI |
 |
|---|
| ArgC ESI |
 |
|---|
| LysN ESI |
 |
|---|
| TryLysC ESI |
 |
|---|
| Try MALDI |
 |
|---|
| ChTry MALDI |
 |
|---|
| ArgC MALDI |
 |
|---|
| LysN MALDI |
 |
|---|
| TryLysC MALDI |
 |
|---|
| Try LTQ |
 |
|---|
| ChTry LTQ |
 |
|---|
| ArgC LTQ |
 |
|---|
| LysN LTQ |
 |
|---|
| TryLysC LTQ |
 |
|---|
| Try MSlow |
 |
|---|
| ChTry MSlow |
 |
|---|
| ArgC MSlow |
 |
|---|
| LysN MSlow |
 |
|---|
| TryLysC MSlow |
 |
|---|
| Try MShigh |
 |
|---|
| ChTry MShigh |
 |
|---|
| ArgC MShigh |
 |
|---|
| LysN MShigh |
 |
|---|
| TryLysC MShigh |
 |
|---|
General Statistics
Number of major isoforms |
Number of additional isoforms |
Number of all proteins |
Number of amino acids |
Min. Seq. Length |
Max. Seq. Length |
Avg. Seq. Length |
Avg. Mol. Weight |
|---|---|---|---|---|---|---|---|
0 |
1239871 |
30 |
3257 |
346.2 |
38.71 |
Amino acid frequency
Ala |
Cys |
Asp |
Glu |
Phe |
Gly |
His |
Ile |
Lys |
Leu |
|---|---|---|---|---|---|---|---|---|---|
8.23 ± 0.046 | 0.883 ± 0.014 |
5.155 ± 0.029 | 5.587 ± 0.052 |
4.669 ± 0.034 | 6.926 ± 0.043 |
1.895 ± 0.023 | 6.763 ± 0.035 |
6.487 ± 0.049 | 9.441 ± 0.053 |
Met |
Asn |
Gln |
Pro |
Arg |
Ser |
Thr |
Val |
Trp |
Tyr |
|---|---|---|---|---|---|---|---|---|---|
2.466 ± 0.023 | 5.229 ± 0.051 |
3.918 ± 0.029 | 3.883 ± 0.029 |
4.551 ± 0.03 | 6.283 ± 0.042 |
5.994 ± 0.076 | 6.447 ± 0.037 |
1.214 ± 0.015 | 3.981 ± 0.03 |
Most of the basic statistics you can see at this page can be downloaded from this CSV file
Proteome-pI is available under Creative Commons Attribution-NoDerivs license, for more details see here
| Reference: Kozlowski LP. Proteome-pI 2.0: Proteome Isoelectric Point Database Update. Nucleic Acids Res. 2021, doi: 10.1093/nar/gkab944 | Contact: Lukasz P. Kozlowski |
