Ruegeria phage DSS3-P1
Taxonomy: Viruses; Duplodnaviria; Heunggongvirae; Uroviricota; Caudoviricetes; Caudovirales; Siphoviridae; unclassified Siphoviridae
Average proteome isoelectric point is 6.14
Get precalculated fractions of proteins

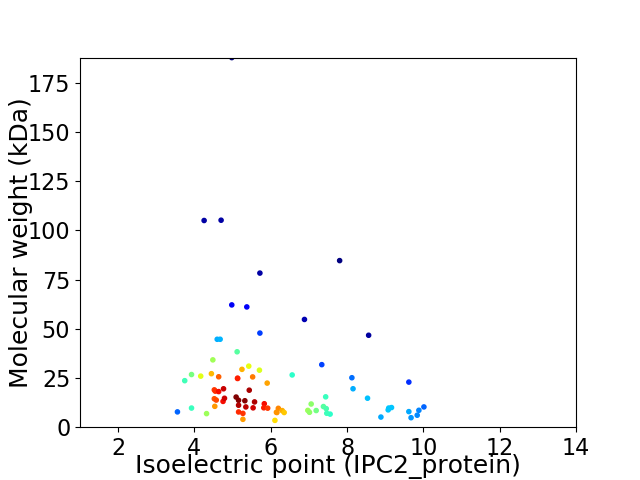
Virtual 2D-PAGE plot for 82 proteins (isoelectric point calculated using IPC2_protein)
Get csv file with sequences according to given criteria:
* You can choose from 21 different methods for calculating isoelectric point
Summary statistics related to proteome-wise predictions


Protein with the lowest isoelectric point:
>tr|A0A097EVU9|A0A097EVU9_9CAUD Uncharacterized protein OS=Ruegeria phage DSS3-P1 OX=1555208 GN=DSS3P1_14 PE=4 SV=1
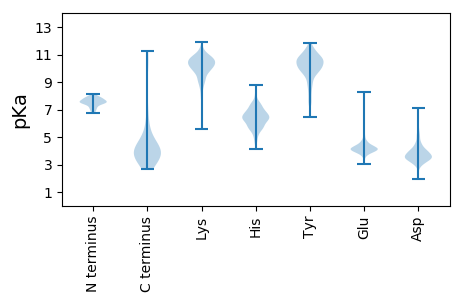
MM1 pKa = 7.46SNTYY5 pKa = 8.72TVAVVEE11 pKa = 4.9GSTPLPPCYY20 pKa = 9.19PDD22 pKa = 3.63PLLYY26 pKa = 10.62VVTVSDD32 pKa = 3.7PHH34 pKa = 8.21DD35 pKa = 4.06SEE37 pKa = 6.28SILDD41 pKa = 3.7QVAEE45 pKa = 4.07ARR47 pKa = 11.84ALEE50 pKa = 4.07LLGEE54 pKa = 4.49PEE56 pKa = 5.59DD57 pKa = 4.07YY58 pKa = 10.73TPQTFDD64 pKa = 3.39ALRR67 pKa = 11.84AGLRR71 pKa = 11.84LLFVLAGDD79 pKa = 4.45VYY81 pKa = 10.73PVADD85 pKa = 4.78FRR87 pKa = 11.84QSS89 pKa = 2.73
MM1 pKa = 7.46SNTYY5 pKa = 8.72TVAVVEE11 pKa = 4.9GSTPLPPCYY20 pKa = 9.19PDD22 pKa = 3.63PLLYY26 pKa = 10.62VVTVSDD32 pKa = 3.7PHH34 pKa = 8.21DD35 pKa = 4.06SEE37 pKa = 6.28SILDD41 pKa = 3.7QVAEE45 pKa = 4.07ARR47 pKa = 11.84ALEE50 pKa = 4.07LLGEE54 pKa = 4.49PEE56 pKa = 5.59DD57 pKa = 4.07YY58 pKa = 10.73TPQTFDD64 pKa = 3.39ALRR67 pKa = 11.84AGLRR71 pKa = 11.84LLFVLAGDD79 pKa = 4.45VYY81 pKa = 10.73PVADD85 pKa = 4.78FRR87 pKa = 11.84QSS89 pKa = 2.73
Molecular weight: 9.73 kDa
Isoelectric point according different methods:
Protein with the highest isoelectric point:
>tr|A0A097EW06|A0A097EW06_9CAUD Uncharacterized protein OS=Ruegeria phage DSS3-P1 OX=1555208 GN=DSS3P1_10 PE=4 SV=1
MM1 pKa = 7.75PPSQIFQNSDD11 pKa = 3.34YY12 pKa = 10.76VVAVEE17 pKa = 4.14GLEE20 pKa = 3.91GLAVDD25 pKa = 4.8FAEE28 pKa = 4.18ITDD31 pKa = 5.04RR32 pKa = 11.84IAEE35 pKa = 4.21RR36 pKa = 11.84ASMAINTTARR46 pKa = 11.84RR47 pKa = 11.84YY48 pKa = 7.34RR49 pKa = 11.84TTSSRR54 pKa = 11.84LIRR57 pKa = 11.84DD58 pKa = 3.26QVAFPARR65 pKa = 11.84YY66 pKa = 9.59LDD68 pKa = 3.8AQANGALRR76 pKa = 11.84VRR78 pKa = 11.84QQATAAKK85 pKa = 9.71LEE87 pKa = 3.97AAIEE91 pKa = 4.25GRR93 pKa = 11.84FDD95 pKa = 3.43PTSLARR101 pKa = 11.84FAKK104 pKa = 9.1GTVAHH109 pKa = 6.37GRR111 pKa = 11.84KK112 pKa = 9.43APRR115 pKa = 11.84LRR117 pKa = 11.84VNPGRR122 pKa = 11.84TTQIPNSFIMNLRR135 pKa = 11.84NGNRR139 pKa = 11.84GLAIRR144 pKa = 11.84LKK146 pKa = 10.44PGEE149 pKa = 4.22TIQNKK154 pKa = 8.83RR155 pKa = 11.84RR156 pKa = 11.84MVSFSRR162 pKa = 11.84KK163 pKa = 9.66DD164 pKa = 3.28SNLYY168 pKa = 10.21LLYY171 pKa = 10.56GPSVDD176 pKa = 3.52QVFRR180 pKa = 11.84SVALDD185 pKa = 3.54VAPDD189 pKa = 3.39AASFLEE195 pKa = 4.38TEE197 pKa = 5.55FIRR200 pKa = 11.84LTEE203 pKa = 3.9NLII206 pKa = 3.93
MM1 pKa = 7.75PPSQIFQNSDD11 pKa = 3.34YY12 pKa = 10.76VVAVEE17 pKa = 4.14GLEE20 pKa = 3.91GLAVDD25 pKa = 4.8FAEE28 pKa = 4.18ITDD31 pKa = 5.04RR32 pKa = 11.84IAEE35 pKa = 4.21RR36 pKa = 11.84ASMAINTTARR46 pKa = 11.84RR47 pKa = 11.84YY48 pKa = 7.34RR49 pKa = 11.84TTSSRR54 pKa = 11.84LIRR57 pKa = 11.84DD58 pKa = 3.26QVAFPARR65 pKa = 11.84YY66 pKa = 9.59LDD68 pKa = 3.8AQANGALRR76 pKa = 11.84VRR78 pKa = 11.84QQATAAKK85 pKa = 9.71LEE87 pKa = 3.97AAIEE91 pKa = 4.25GRR93 pKa = 11.84FDD95 pKa = 3.43PTSLARR101 pKa = 11.84FAKK104 pKa = 9.1GTVAHH109 pKa = 6.37GRR111 pKa = 11.84KK112 pKa = 9.43APRR115 pKa = 11.84LRR117 pKa = 11.84VNPGRR122 pKa = 11.84TTQIPNSFIMNLRR135 pKa = 11.84NGNRR139 pKa = 11.84GLAIRR144 pKa = 11.84LKK146 pKa = 10.44PGEE149 pKa = 4.22TIQNKK154 pKa = 8.83RR155 pKa = 11.84RR156 pKa = 11.84MVSFSRR162 pKa = 11.84KK163 pKa = 9.66DD164 pKa = 3.28SNLYY168 pKa = 10.21LLYY171 pKa = 10.56GPSVDD176 pKa = 3.52QVFRR180 pKa = 11.84SVALDD185 pKa = 3.54VAPDD189 pKa = 3.39AASFLEE195 pKa = 4.38TEE197 pKa = 5.55FIRR200 pKa = 11.84LTEE203 pKa = 3.9NLII206 pKa = 3.93
Molecular weight: 22.91 kDa
Isoelectric point according different methods:
Peptides (in silico digests for buttom-up proteomics)
Below you can find in silico digests of the whole proteome with Trypsin, Chymotrypsin, Trypsin+LysC, LysN, ArgC proteases suitable for different mass spec machines.| Try ESI |
 |
|---|
| ChTry ESI |
 |
|---|
| ArgC ESI |
 |
|---|
| LysN ESI |
 |
|---|
| TryLysC ESI |
 |
|---|
| Try MALDI |
 |
|---|
| ChTry MALDI |
 |
|---|
| ArgC MALDI |
 |
|---|
| LysN MALDI |
 |
|---|
| TryLysC MALDI |
 |
|---|
| Try LTQ |
 |
|---|
| ChTry LTQ |
 |
|---|
| ArgC LTQ |
 |
|---|
| LysN LTQ |
 |
|---|
| TryLysC LTQ |
 |
|---|
| Try MSlow |
 |
|---|
| ChTry MSlow |
 |
|---|
| ArgC MSlow |
 |
|---|
| LysN MSlow |
 |
|---|
| TryLysC MSlow |
 |
|---|
| Try MShigh |
 |
|---|
| ChTry MShigh |
 |
|---|
| ArgC MShigh |
 |
|---|
| LysN MShigh |
 |
|---|
| TryLysC MShigh |
 |
|---|
General Statistics
Number of major isoforms |
Number of additional isoforms |
Number of all proteins |
Number of amino acids |
Min. Seq. Length |
Max. Seq. Length |
Avg. Seq. Length |
Avg. Mol. Weight |
|---|---|---|---|---|---|---|---|
0 |
17943 |
31 |
1744 |
218.8 |
24.07 |
Amino acid frequency
Ala |
Cys |
Asp |
Glu |
Phe |
Gly |
His |
Ile |
Lys |
Leu |
|---|---|---|---|---|---|---|---|---|---|
11.704 ± 0.613 | 0.83 ± 0.121 |
6.705 ± 0.294 | 7.279 ± 0.322 |
3.439 ± 0.132 | 8.12 ± 0.255 |
1.984 ± 0.176 | 4.436 ± 0.146 |
4.002 ± 0.316 | 8.789 ± 0.216 |
Met |
Asn |
Gln |
Pro |
Arg |
Ser |
Thr |
Val |
Trp |
Tyr |
|---|---|---|---|---|---|---|---|---|---|
2.252 ± 0.13 | 3.138 ± 0.156 |
5.027 ± 0.418 | 3.361 ± 0.289 |
7.156 ± 0.309 | 4.904 ± 0.171 |
5.902 ± 0.308 | 6.716 ± 0.198 |
1.672 ± 0.167 | 2.586 ± 0.164 |
Most of the basic statistics you can see at this page can be downloaded from this CSV file
Proteome-pI is available under Creative Commons Attribution-NoDerivs license, for more details see here
| Reference: Kozlowski LP. Proteome-pI 2.0: Proteome Isoelectric Point Database Update. Nucleic Acids Res. 2021, doi: 10.1093/nar/gkab944 | Contact: Lukasz P. Kozlowski |
