Actinomadura craniellae
Taxonomy: cellular organisms; Bacteria; Terrabacteria group; Actinobacteria; Actinomycetia; Streptosporangiales; Thermomonosporaceae; Actinomadura
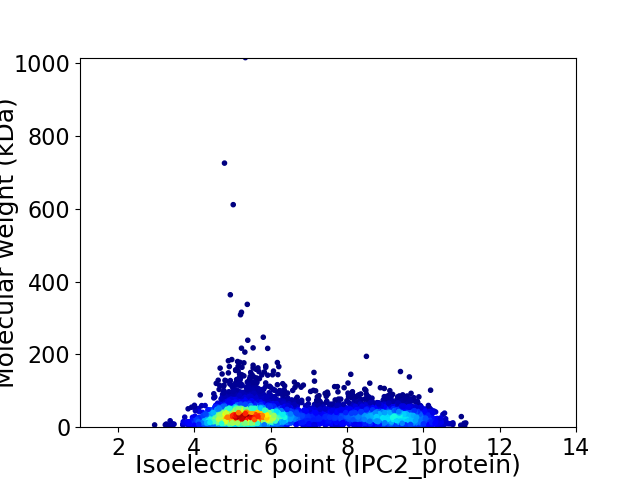
Average proteome isoelectric point is 6.54
Get precalculated fractions of proteins

Virtual 2D-PAGE plot for 6713 proteins (isoelectric point calculated using IPC2_protein)
Get csv file with sequences according to given criteria:
* You can choose from 21 different methods for calculating isoelectric point
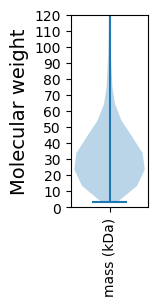
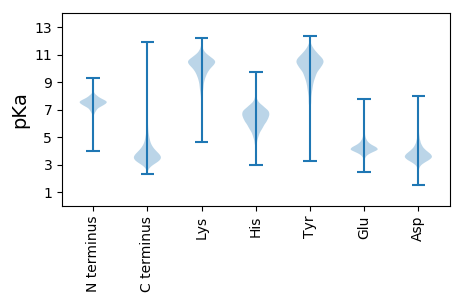
Summary statistics related to proteome-wise predictions


Protein with the lowest isoelectric point:
>tr|A0A365H9A6|A0A365H9A6_9ACTN Serine/threonine-protein phosphatase OS=Actinomadura craniellae OX=2231787 GN=DPM19_14150 PE=4 SV=1
MM1 pKa = 7.3ALEE4 pKa = 4.1VSGEE8 pKa = 3.99RR9 pKa = 11.84RR10 pKa = 11.84SGDD13 pKa = 3.05GTADD17 pKa = 3.45LVAYY21 pKa = 10.21LEE23 pKa = 4.03QDD25 pKa = 3.76DD26 pKa = 4.23PDD28 pKa = 4.55GYY30 pKa = 9.26PVHH33 pKa = 6.49RR34 pKa = 11.84VVVAVCAACSGTTFGLLADD53 pKa = 4.48DD54 pKa = 4.71AEE56 pKa = 4.67SVVRR60 pKa = 11.84RR61 pKa = 11.84TCAGCGEE68 pKa = 4.41SALMLDD74 pKa = 5.52SEE76 pKa = 5.65DD77 pKa = 3.86YY78 pKa = 10.62WDD80 pKa = 4.53DD81 pKa = 3.64ADD83 pKa = 4.65PEE85 pKa = 4.48VIEE88 pKa = 4.8CEE90 pKa = 4.19CGGEE94 pKa = 4.07EE95 pKa = 4.53FEE97 pKa = 4.62VAVGFTMRR105 pKa = 11.84TGADD109 pKa = 3.21EE110 pKa = 4.1TDD112 pKa = 3.17EE113 pKa = 4.15VRR115 pKa = 11.84WVSVGVRR122 pKa = 11.84CVRR125 pKa = 11.84DD126 pKa = 3.44GRR128 pKa = 11.84LGYY131 pKa = 10.24CADD134 pKa = 3.26WKK136 pKa = 10.5IDD138 pKa = 3.68YY139 pKa = 10.67SPSSDD144 pKa = 3.67LLDD147 pKa = 3.52RR148 pKa = 11.84VV149 pKa = 3.73
MM1 pKa = 7.3ALEE4 pKa = 4.1VSGEE8 pKa = 3.99RR9 pKa = 11.84RR10 pKa = 11.84SGDD13 pKa = 3.05GTADD17 pKa = 3.45LVAYY21 pKa = 10.21LEE23 pKa = 4.03QDD25 pKa = 3.76DD26 pKa = 4.23PDD28 pKa = 4.55GYY30 pKa = 9.26PVHH33 pKa = 6.49RR34 pKa = 11.84VVVAVCAACSGTTFGLLADD53 pKa = 4.48DD54 pKa = 4.71AEE56 pKa = 4.67SVVRR60 pKa = 11.84RR61 pKa = 11.84TCAGCGEE68 pKa = 4.41SALMLDD74 pKa = 5.52SEE76 pKa = 5.65DD77 pKa = 3.86YY78 pKa = 10.62WDD80 pKa = 4.53DD81 pKa = 3.64ADD83 pKa = 4.65PEE85 pKa = 4.48VIEE88 pKa = 4.8CEE90 pKa = 4.19CGGEE94 pKa = 4.07EE95 pKa = 4.53FEE97 pKa = 4.62VAVGFTMRR105 pKa = 11.84TGADD109 pKa = 3.21EE110 pKa = 4.1TDD112 pKa = 3.17EE113 pKa = 4.15VRR115 pKa = 11.84WVSVGVRR122 pKa = 11.84CVRR125 pKa = 11.84DD126 pKa = 3.44GRR128 pKa = 11.84LGYY131 pKa = 10.24CADD134 pKa = 3.26WKK136 pKa = 10.5IDD138 pKa = 3.68YY139 pKa = 10.67SPSSDD144 pKa = 3.67LLDD147 pKa = 3.52RR148 pKa = 11.84VV149 pKa = 3.73
Molecular weight: 16.12 kDa
Isoelectric point according different methods:
Protein with the highest isoelectric point:
>tr|A0A365H6R7|A0A365H6R7_9ACTN Uncharacterized protein OS=Actinomadura craniellae OX=2231787 GN=DPM19_13825 PE=4 SV=1
MM1 pKa = 7.33TGAITMRR8 pKa = 11.84DD9 pKa = 3.51RR10 pKa = 11.84VHH12 pKa = 6.93SSAGRR17 pKa = 11.84LIRR20 pKa = 11.84GWITSTRR27 pKa = 11.84VAALVITRR35 pKa = 11.84RR36 pKa = 11.84SSARR40 pKa = 11.84ARR42 pKa = 11.84ASQPVTSRR50 pKa = 11.84SRR52 pKa = 11.84STAFASPSLSSTNVPAGVATGRR74 pKa = 11.84FTPHH78 pKa = 5.18STRR81 pKa = 11.84PAAPVPAPAHH91 pKa = 5.69RR92 pKa = 11.84AWPGSPRR99 pKa = 11.84RR100 pKa = 3.8
MM1 pKa = 7.33TGAITMRR8 pKa = 11.84DD9 pKa = 3.51RR10 pKa = 11.84VHH12 pKa = 6.93SSAGRR17 pKa = 11.84LIRR20 pKa = 11.84GWITSTRR27 pKa = 11.84VAALVITRR35 pKa = 11.84RR36 pKa = 11.84SSARR40 pKa = 11.84ARR42 pKa = 11.84ASQPVTSRR50 pKa = 11.84SRR52 pKa = 11.84STAFASPSLSSTNVPAGVATGRR74 pKa = 11.84FTPHH78 pKa = 5.18STRR81 pKa = 11.84PAAPVPAPAHH91 pKa = 5.69RR92 pKa = 11.84AWPGSPRR99 pKa = 11.84RR100 pKa = 3.8
Molecular weight: 10.57 kDa
Isoelectric point according different methods:
Peptides (in silico digests for buttom-up proteomics)
Below you can find in silico digests of the whole proteome with Trypsin, Chymotrypsin, Trypsin+LysC, LysN, ArgC proteases suitable for different mass spec machines.| Try ESI |
 |
|---|
| ChTry ESI |
 |
|---|
| ArgC ESI |
 |
|---|
| LysN ESI |
 |
|---|
| TryLysC ESI |
 |
|---|
| Try MALDI |
 |
|---|
| ChTry MALDI |
 |
|---|
| ArgC MALDI |
 |
|---|
| LysN MALDI |
 |
|---|
| TryLysC MALDI |
 |
|---|
| Try LTQ |
 |
|---|
| ChTry LTQ |
 |
|---|
| ArgC LTQ |
 |
|---|
| LysN LTQ |
 |
|---|
| TryLysC LTQ |
 |
|---|
| Try MSlow |
 |
|---|
| ChTry MSlow |
 |
|---|
| ArgC MSlow |
 |
|---|
| LysN MSlow |
 |
|---|
| TryLysC MSlow |
 |
|---|
| Try MShigh |
 |
|---|
| ChTry MShigh |
 |
|---|
| ArgC MShigh |
 |
|---|
| LysN MShigh |
 |
|---|
| TryLysC MShigh |
 |
|---|
General Statistics
Number of major isoforms |
Number of additional isoforms |
Number of all proteins |
Number of amino acids |
Min. Seq. Length |
Max. Seq. Length |
Avg. Seq. Length |
Avg. Mol. Weight |
|---|---|---|---|---|---|---|---|
0 |
2180549 |
27 |
9536 |
324.8 |
34.89 |
Amino acid frequency
Ala |
Cys |
Asp |
Glu |
Phe |
Gly |
His |
Ile |
Lys |
Leu |
|---|---|---|---|---|---|---|---|---|---|
13.584 ± 0.049 | 0.795 ± 0.008 |
5.952 ± 0.022 | 5.789 ± 0.027 |
2.737 ± 0.015 | 9.532 ± 0.03 |
2.259 ± 0.016 | 3.434 ± 0.021 |
1.755 ± 0.023 | 10.592 ± 0.035 |
Met |
Asn |
Gln |
Pro |
Arg |
Ser |
Thr |
Val |
Trp |
Tyr |
|---|---|---|---|---|---|---|---|---|---|
1.765 ± 0.013 | 1.669 ± 0.015 |
6.46 ± 0.033 | 2.617 ± 0.02 |
8.837 ± 0.034 | 4.479 ± 0.019 |
5.746 ± 0.024 | 8.443 ± 0.028 |
1.529 ± 0.013 | 2.027 ± 0.014 |
Most of the basic statistics you can see at this page can be downloaded from this CSV file
Proteome-pI is available under Creative Commons Attribution-NoDerivs license, for more details see here
| Reference: Kozlowski LP. Proteome-pI 2.0: Proteome Isoelectric Point Database Update. Nucleic Acids Res. 2021, doi: 10.1093/nar/gkab944 | Contact: Lukasz P. Kozlowski |
