Wenzhouxiangella sp. XN24
Taxonomy: cellular organisms; Bacteria; Proteobacteria; Gammaproteobacteria; Chromatiales; Wenzhouxiangellaceae; Wenzhouxiangella; unclassified Wenzhouxiangella
Average proteome isoelectric point is 6.22
Get precalculated fractions of proteins

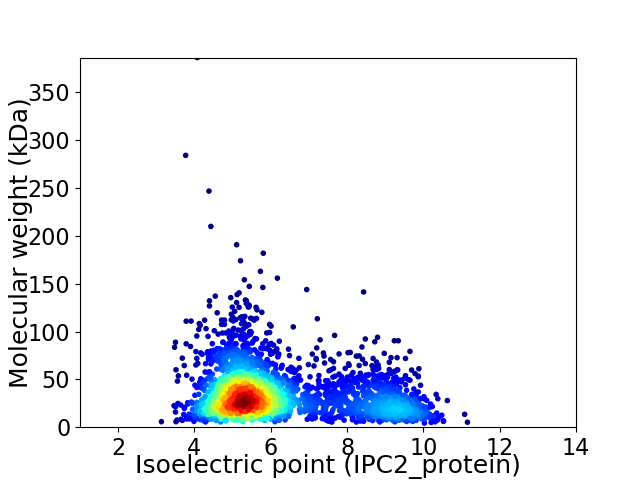
Virtual 2D-PAGE plot for 3004 proteins (isoelectric point calculated using IPC2_protein)
Get csv file with sequences according to given criteria:
* You can choose from 21 different methods for calculating isoelectric point
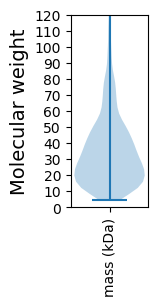
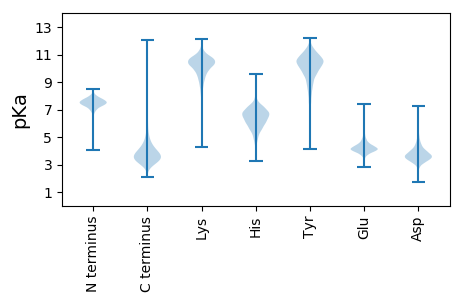
Summary statistics related to proteome-wise predictions


Protein with the lowest isoelectric point:
>tr|A0A6M1Y5S4|A0A6M1Y5S4_9GAMM MMPL family transporter OS=Wenzhouxiangella sp. XN24 OX=2713569 GN=G6032_05130 PE=4 SV=1
MM1 pKa = 7.36RR2 pKa = 11.84TFASTLALAAALGLAAPAYY21 pKa = 9.94AHH23 pKa = 6.9EE24 pKa = 4.92AGDD27 pKa = 3.34WLVRR31 pKa = 11.84FGGSNIDD38 pKa = 3.59PKK40 pKa = 11.12SDD42 pKa = 3.43NGSLDD47 pKa = 3.22LTAAGLEE54 pKa = 4.51GVAVQDD60 pKa = 3.93VNVDD64 pKa = 3.5SQIGVTFNITYY75 pKa = 8.84MYY77 pKa = 8.09TANLGIEE84 pKa = 4.44LLAALPYY91 pKa = 10.27EE92 pKa = 4.38HH93 pKa = 7.59DD94 pKa = 3.84IEE96 pKa = 4.74VAGLPGTAATVTHH109 pKa = 6.92LPPTLSLQYY118 pKa = 10.72HH119 pKa = 6.1FMPDD123 pKa = 3.08AVFQPYY129 pKa = 9.83VGAGLNLTWFLDD141 pKa = 3.74DD142 pKa = 4.14SKK144 pKa = 11.86EE145 pKa = 4.1EE146 pKa = 4.06GLVAADD152 pKa = 4.02GLLGATTGLDD162 pKa = 3.23VDD164 pKa = 4.24STSVGLAAQVGFDD177 pKa = 4.2YY178 pKa = 10.73IVNDD182 pKa = 3.07TWFINFDD189 pKa = 3.67VRR191 pKa = 11.84WIDD194 pKa = 2.99ISTDD198 pKa = 2.85ATLTVDD204 pKa = 3.57GADD207 pKa = 3.41FSTAKK212 pKa = 10.37VDD214 pKa = 3.21IDD216 pKa = 4.25PIVYY220 pKa = 9.88GLHH223 pKa = 5.24IGYY226 pKa = 9.94RR227 pKa = 11.84FF228 pKa = 3.18
MM1 pKa = 7.36RR2 pKa = 11.84TFASTLALAAALGLAAPAYY21 pKa = 9.94AHH23 pKa = 6.9EE24 pKa = 4.92AGDD27 pKa = 3.34WLVRR31 pKa = 11.84FGGSNIDD38 pKa = 3.59PKK40 pKa = 11.12SDD42 pKa = 3.43NGSLDD47 pKa = 3.22LTAAGLEE54 pKa = 4.51GVAVQDD60 pKa = 3.93VNVDD64 pKa = 3.5SQIGVTFNITYY75 pKa = 8.84MYY77 pKa = 8.09TANLGIEE84 pKa = 4.44LLAALPYY91 pKa = 10.27EE92 pKa = 4.38HH93 pKa = 7.59DD94 pKa = 3.84IEE96 pKa = 4.74VAGLPGTAATVTHH109 pKa = 6.92LPPTLSLQYY118 pKa = 10.72HH119 pKa = 6.1FMPDD123 pKa = 3.08AVFQPYY129 pKa = 9.83VGAGLNLTWFLDD141 pKa = 3.74DD142 pKa = 4.14SKK144 pKa = 11.86EE145 pKa = 4.1EE146 pKa = 4.06GLVAADD152 pKa = 4.02GLLGATTGLDD162 pKa = 3.23VDD164 pKa = 4.24STSVGLAAQVGFDD177 pKa = 4.2YY178 pKa = 10.73IVNDD182 pKa = 3.07TWFINFDD189 pKa = 3.67VRR191 pKa = 11.84WIDD194 pKa = 2.99ISTDD198 pKa = 2.85ATLTVDD204 pKa = 3.57GADD207 pKa = 3.41FSTAKK212 pKa = 10.37VDD214 pKa = 3.21IDD216 pKa = 4.25PIVYY220 pKa = 9.88GLHH223 pKa = 5.24IGYY226 pKa = 9.94RR227 pKa = 11.84FF228 pKa = 3.18
Molecular weight: 24.18 kDa
Isoelectric point according different methods:
Protein with the highest isoelectric point:
>tr|A0A6M1YDS7|A0A6M1YDS7_9GAMM Uncharacterized protein OS=Wenzhouxiangella sp. XN24 OX=2713569 GN=G6032_14655 PE=4 SV=1
MM1 pKa = 7.35KK2 pKa = 9.44RR3 pKa = 11.84TYY5 pKa = 10.28QPSNLRR11 pKa = 11.84RR12 pKa = 11.84KK13 pKa = 8.16RR14 pKa = 11.84THH16 pKa = 5.96GFRR19 pKa = 11.84ARR21 pKa = 11.84MATKK25 pKa = 10.24NGRR28 pKa = 11.84LVLSRR33 pKa = 11.84RR34 pKa = 11.84RR35 pKa = 11.84AKK37 pKa = 10.38GRR39 pKa = 11.84ARR41 pKa = 11.84LAVV44 pKa = 3.42
MM1 pKa = 7.35KK2 pKa = 9.44RR3 pKa = 11.84TYY5 pKa = 10.28QPSNLRR11 pKa = 11.84RR12 pKa = 11.84KK13 pKa = 8.16RR14 pKa = 11.84THH16 pKa = 5.96GFRR19 pKa = 11.84ARR21 pKa = 11.84MATKK25 pKa = 10.24NGRR28 pKa = 11.84LVLSRR33 pKa = 11.84RR34 pKa = 11.84RR35 pKa = 11.84AKK37 pKa = 10.38GRR39 pKa = 11.84ARR41 pKa = 11.84LAVV44 pKa = 3.42
Molecular weight: 5.22 kDa
Isoelectric point according different methods:
Peptides (in silico digests for buttom-up proteomics)
Below you can find in silico digests of the whole proteome with Trypsin, Chymotrypsin, Trypsin+LysC, LysN, ArgC proteases suitable for different mass spec machines.| Try ESI |
 |
|---|
| ChTry ESI |
 |
|---|
| ArgC ESI |
 |
|---|
| LysN ESI |
 |
|---|
| TryLysC ESI |
 |
|---|
| Try MALDI |
 |
|---|
| ChTry MALDI |
 |
|---|
| ArgC MALDI |
 |
|---|
| LysN MALDI |
 |
|---|
| TryLysC MALDI |
 |
|---|
| Try LTQ |
 |
|---|
| ChTry LTQ |
 |
|---|
| ArgC LTQ |
 |
|---|
| LysN LTQ |
 |
|---|
| TryLysC LTQ |
 |
|---|
| Try MSlow |
 |
|---|
| ChTry MSlow |
 |
|---|
| ArgC MSlow |
 |
|---|
| LysN MSlow |
 |
|---|
| TryLysC MSlow |
 |
|---|
| Try MShigh |
 |
|---|
| ChTry MShigh |
 |
|---|
| ArgC MShigh |
 |
|---|
| LysN MShigh |
 |
|---|
| TryLysC MShigh |
 |
|---|
General Statistics
Number of major isoforms |
Number of additional isoforms |
Number of all proteins |
Number of amino acids |
Min. Seq. Length |
Max. Seq. Length |
Avg. Seq. Length |
Avg. Mol. Weight |
|---|---|---|---|---|---|---|---|
0 |
1008693 |
37 |
3642 |
335.8 |
36.57 |
Amino acid frequency
Ala |
Cys |
Asp |
Glu |
Phe |
Gly |
His |
Ile |
Lys |
Leu |
|---|---|---|---|---|---|---|---|---|---|
12.552 ± 0.063 | 0.835 ± 0.015 |
5.843 ± 0.038 | 6.488 ± 0.04 |
3.607 ± 0.03 | 8.735 ± 0.045 |
2.071 ± 0.022 | 4.468 ± 0.032 |
2.234 ± 0.033 | 10.951 ± 0.061 |
Met |
Asn |
Gln |
Pro |
Arg |
Ser |
Thr |
Val |
Trp |
Tyr |
|---|---|---|---|---|---|---|---|---|---|
2.243 ± 0.021 | 2.28 ± 0.021 |
5.332 ± 0.033 | 3.066 ± 0.024 |
8.097 ± 0.048 | 5.026 ± 0.028 |
4.786 ± 0.034 | 7.669 ± 0.041 |
1.473 ± 0.019 | 2.244 ± 0.022 |
Most of the basic statistics you can see at this page can be downloaded from this CSV file
Proteome-pI is available under Creative Commons Attribution-NoDerivs license, for more details see here
| Reference: Kozlowski LP. Proteome-pI 2.0: Proteome Isoelectric Point Database Update. Nucleic Acids Res. 2021, doi: 10.1093/nar/gkab944 | Contact: Lukasz P. Kozlowski |
