Desulfosporosinus acidiphilus (strain DSM 22704 / JCM 16185 / SJ4)
Taxonomy: cellular organisms; Bacteria; Terrabacteria group; Firmicutes; Clostridia; Eubacteriales; Peptococcaceae; Desulfosporosinus; Desulfosporosinus acidiphilus
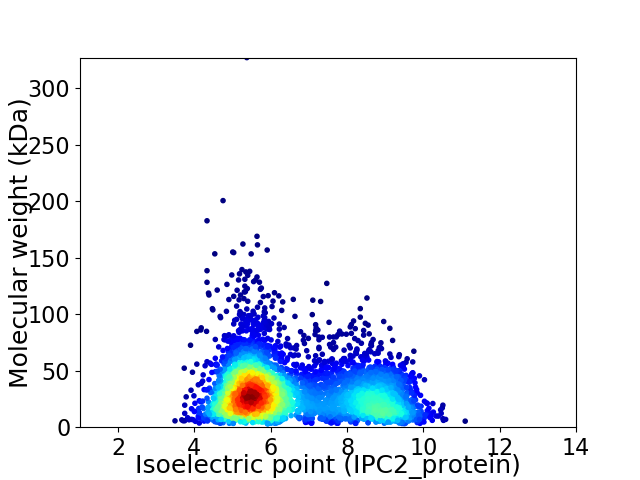
Average proteome isoelectric point is 6.53
Get precalculated fractions of proteins

Virtual 2D-PAGE plot for 4469 proteins (isoelectric point calculated using IPC2_protein)
Get csv file with sequences according to given criteria:
* You can choose from 21 different methods for calculating isoelectric point
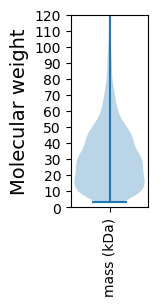
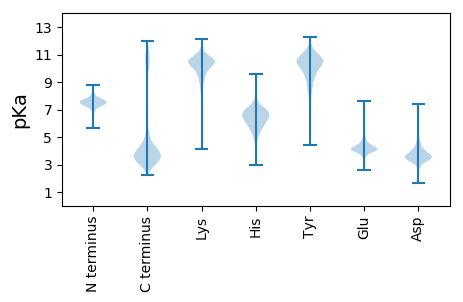
Summary statistics related to proteome-wise predictions


Protein with the lowest isoelectric point:
>tr|I4DAC0|I4DAC0_DESAJ Putative aminopeptidase OS=Desulfosporosinus acidiphilus (strain DSM 22704 / JCM 16185 / SJ4) OX=646529 GN=Desaci_3863 PE=4 SV=1
MM1 pKa = 7.29SVSSTSTSTALTGLSGYY18 pKa = 10.18DD19 pKa = 3.25FSGVISAMMQNYY31 pKa = 8.92DD32 pKa = 3.7LPEE35 pKa = 4.15TQMQTQEE42 pKa = 4.17STLQSQQSAWQAINTSLSALNDD64 pKa = 4.02TITALQSADD73 pKa = 2.81TWDD76 pKa = 3.44ATTATSSNTSAVTATGGSGAMAGNYY101 pKa = 7.07TVNVTQTAKK110 pKa = 10.95AEE112 pKa = 4.13NVVTKK117 pKa = 10.42VMQNTNLSSNNWSFQIGVGTNPLQNVTISSQTPTLTDD154 pKa = 2.82IVNAINSAQAGVTATLIQIDD174 pKa = 4.1SNNDD178 pKa = 2.96YY179 pKa = 10.51RR180 pKa = 11.84ISITANQTGANNYY193 pKa = 9.39VKK195 pKa = 10.73FSDD198 pKa = 3.76PNGAISNLGITLDD211 pKa = 3.64STTGQVAASDD221 pKa = 4.35DD222 pKa = 3.86FTGNLSAMTSAQGGITQDD240 pKa = 3.31SQDD243 pKa = 3.97ASFTMNGISISSASNTVTSAIQGVTLNLLAGGSSTVSVAADD284 pKa = 3.05SSVAQKK290 pKa = 10.72AVQSFVDD297 pKa = 5.0AYY299 pKa = 11.49NSTQSLIASDD309 pKa = 4.79LNYY312 pKa = 9.4DD313 pKa = 3.9TTTKK317 pKa = 10.01TAGALFGDD325 pKa = 4.35AQLEE329 pKa = 4.61DD330 pKa = 3.32IQSRR334 pKa = 11.84LRR336 pKa = 11.84QMMGSTFLNQTSPDD350 pKa = 3.7NLLSTVGISTSSDD363 pKa = 2.96NFGEE367 pKa = 4.5SAALTFDD374 pKa = 3.36TSKK377 pKa = 10.58FAQAYY382 pKa = 7.28AANPQSVANLFSAPYY397 pKa = 10.35NGVTPSNGLGGTAIQGLGNTLSAYY421 pKa = 10.27LNPLIEE427 pKa = 4.36YY428 pKa = 10.14GGTLSEE434 pKa = 4.68INTNYY439 pKa = 10.53SNQISNLEE447 pKa = 4.09TQISDD452 pKa = 3.65FQEE455 pKa = 3.77QSTNYY460 pKa = 10.32QNMLNAKK467 pKa = 7.5FTNLEE472 pKa = 4.27TILSKK477 pKa = 11.08LNSQGTWLTNQINSLPSYY495 pKa = 10.21SSSSSSKK502 pKa = 10.71
MM1 pKa = 7.29SVSSTSTSTALTGLSGYY18 pKa = 10.18DD19 pKa = 3.25FSGVISAMMQNYY31 pKa = 8.92DD32 pKa = 3.7LPEE35 pKa = 4.15TQMQTQEE42 pKa = 4.17STLQSQQSAWQAINTSLSALNDD64 pKa = 4.02TITALQSADD73 pKa = 2.81TWDD76 pKa = 3.44ATTATSSNTSAVTATGGSGAMAGNYY101 pKa = 7.07TVNVTQTAKK110 pKa = 10.95AEE112 pKa = 4.13NVVTKK117 pKa = 10.42VMQNTNLSSNNWSFQIGVGTNPLQNVTISSQTPTLTDD154 pKa = 2.82IVNAINSAQAGVTATLIQIDD174 pKa = 4.1SNNDD178 pKa = 2.96YY179 pKa = 10.51RR180 pKa = 11.84ISITANQTGANNYY193 pKa = 9.39VKK195 pKa = 10.73FSDD198 pKa = 3.76PNGAISNLGITLDD211 pKa = 3.64STTGQVAASDD221 pKa = 4.35DD222 pKa = 3.86FTGNLSAMTSAQGGITQDD240 pKa = 3.31SQDD243 pKa = 3.97ASFTMNGISISSASNTVTSAIQGVTLNLLAGGSSTVSVAADD284 pKa = 3.05SSVAQKK290 pKa = 10.72AVQSFVDD297 pKa = 5.0AYY299 pKa = 11.49NSTQSLIASDD309 pKa = 4.79LNYY312 pKa = 9.4DD313 pKa = 3.9TTTKK317 pKa = 10.01TAGALFGDD325 pKa = 4.35AQLEE329 pKa = 4.61DD330 pKa = 3.32IQSRR334 pKa = 11.84LRR336 pKa = 11.84QMMGSTFLNQTSPDD350 pKa = 3.7NLLSTVGISTSSDD363 pKa = 2.96NFGEE367 pKa = 4.5SAALTFDD374 pKa = 3.36TSKK377 pKa = 10.58FAQAYY382 pKa = 7.28AANPQSVANLFSAPYY397 pKa = 10.35NGVTPSNGLGGTAIQGLGNTLSAYY421 pKa = 10.27LNPLIEE427 pKa = 4.36YY428 pKa = 10.14GGTLSEE434 pKa = 4.68INTNYY439 pKa = 10.53SNQISNLEE447 pKa = 4.09TQISDD452 pKa = 3.65FQEE455 pKa = 3.77QSTNYY460 pKa = 10.32QNMLNAKK467 pKa = 7.5FTNLEE472 pKa = 4.27TILSKK477 pKa = 11.08LNSQGTWLTNQINSLPSYY495 pKa = 10.21SSSSSSKK502 pKa = 10.71
Molecular weight: 52.27 kDa
Isoelectric point according different methods:
Protein with the highest isoelectric point:
>tr|I4D002|I4D002_DESAJ Uncharacterized protein OS=Desulfosporosinus acidiphilus (strain DSM 22704 / JCM 16185 / SJ4) OX=646529 GN=Desaci_0005 PE=4 SV=1
MM1 pKa = 7.36KK2 pKa = 9.44RR3 pKa = 11.84TYY5 pKa = 9.19QPKK8 pKa = 8.78NRR10 pKa = 11.84RR11 pKa = 11.84HH12 pKa = 5.44KK13 pKa = 10.09RR14 pKa = 11.84VHH16 pKa = 5.93GFLSRR21 pKa = 11.84MSTPTGRR28 pKa = 11.84NVIKK32 pKa = 10.5RR33 pKa = 11.84RR34 pKa = 11.84RR35 pKa = 11.84LKK37 pKa = 10.52GRR39 pKa = 11.84KK40 pKa = 8.8KK41 pKa = 10.81LSVV44 pKa = 3.15
MM1 pKa = 7.36KK2 pKa = 9.44RR3 pKa = 11.84TYY5 pKa = 9.19QPKK8 pKa = 8.78NRR10 pKa = 11.84RR11 pKa = 11.84HH12 pKa = 5.44KK13 pKa = 10.09RR14 pKa = 11.84VHH16 pKa = 5.93GFLSRR21 pKa = 11.84MSTPTGRR28 pKa = 11.84NVIKK32 pKa = 10.5RR33 pKa = 11.84RR34 pKa = 11.84RR35 pKa = 11.84LKK37 pKa = 10.52GRR39 pKa = 11.84KK40 pKa = 8.8KK41 pKa = 10.81LSVV44 pKa = 3.15
Molecular weight: 5.36 kDa
Isoelectric point according different methods:
Peptides (in silico digests for buttom-up proteomics)
Below you can find in silico digests of the whole proteome with Trypsin, Chymotrypsin, Trypsin+LysC, LysN, ArgC proteases suitable for different mass spec machines.| Try ESI |
 |
|---|
| ChTry ESI |
 |
|---|
| ArgC ESI |
 |
|---|
| LysN ESI |
 |
|---|
| TryLysC ESI |
 |
|---|
| Try MALDI |
 |
|---|
| ChTry MALDI |
 |
|---|
| ArgC MALDI |
 |
|---|
| LysN MALDI |
 |
|---|
| TryLysC MALDI |
 |
|---|
| Try LTQ |
 |
|---|
| ChTry LTQ |
 |
|---|
| ArgC LTQ |
 |
|---|
| LysN LTQ |
 |
|---|
| TryLysC LTQ |
 |
|---|
| Try MSlow |
 |
|---|
| ChTry MSlow |
 |
|---|
| ArgC MSlow |
 |
|---|
| LysN MSlow |
 |
|---|
| TryLysC MSlow |
 |
|---|
| Try MShigh |
 |
|---|
| ChTry MShigh |
 |
|---|
| ArgC MShigh |
 |
|---|
| LysN MShigh |
 |
|---|
| TryLysC MShigh |
 |
|---|
General Statistics
Number of major isoforms |
Number of additional isoforms |
Number of all proteins |
Number of amino acids |
Min. Seq. Length |
Max. Seq. Length |
Avg. Seq. Length |
Avg. Mol. Weight |
|---|---|---|---|---|---|---|---|
0 |
1329414 |
29 |
2862 |
297.5 |
33.09 |
Amino acid frequency
Ala |
Cys |
Asp |
Glu |
Phe |
Gly |
His |
Ile |
Lys |
Leu |
|---|---|---|---|---|---|---|---|---|---|
7.588 ± 0.042 | 1.094 ± 0.015 |
4.785 ± 0.026 | 6.611 ± 0.044 |
4.129 ± 0.03 | 7.431 ± 0.038 |
1.848 ± 0.016 | 7.499 ± 0.038 |
6.046 ± 0.031 | 10.484 ± 0.046 |
Met |
Asn |
Gln |
Pro |
Arg |
Ser |
Thr |
Val |
Trp |
Tyr |
|---|---|---|---|---|---|---|---|---|---|
2.595 ± 0.019 | 4.327 ± 0.032 |
3.973 ± 0.025 | 3.875 ± 0.029 |
4.636 ± 0.033 | 6.353 ± 0.037 |
5.405 ± 0.042 | 6.987 ± 0.031 |
1.093 ± 0.017 | 3.241 ± 0.024 |
Most of the basic statistics you can see at this page can be downloaded from this CSV file
Proteome-pI is available under Creative Commons Attribution-NoDerivs license, for more details see here
| Reference: Kozlowski LP. Proteome-pI 2.0: Proteome Isoelectric Point Database Update. Nucleic Acids Res. 2021, doi: 10.1093/nar/gkab944 | Contact: Lukasz P. Kozlowski |
