Apis mellifera associated microvirus 37
Taxonomy: Viruses; Monodnaviria; Sangervirae; Phixviricota; Malgrandaviricetes; Petitvirales; Microviridae; unclassified Microviridae
Average proteome isoelectric point is 7.47
Get precalculated fractions of proteins

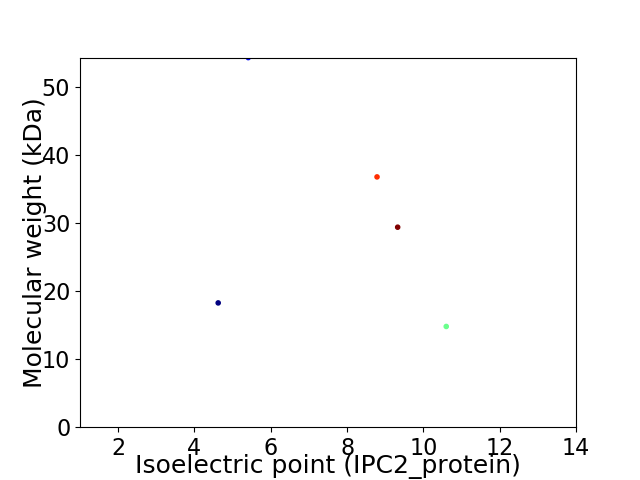
Virtual 2D-PAGE plot for 5 proteins (isoelectric point calculated using IPC2_protein)
Get csv file with sequences according to given criteria:
* You can choose from 21 different methods for calculating isoelectric point
Summary statistics related to proteome-wise predictions


Protein with the lowest isoelectric point:
>tr|A0A3S8UTF9|A0A3S8UTF9_9VIRU DNA pilot protein OS=Apis mellifera associated microvirus 37 OX=2494766 PE=4 SV=1
MM1 pKa = 6.67THH3 pKa = 5.37VSKK6 pKa = 10.8FIEE9 pKa = 4.62APQDD13 pKa = 3.77PEE15 pKa = 5.6DD16 pKa = 4.29LLQPSYY22 pKa = 11.57AVVNPKK28 pKa = 9.23TGALKK33 pKa = 10.17EE34 pKa = 4.37YY35 pKa = 7.76PACMAPIAADD45 pKa = 3.55AQRR48 pKa = 11.84LDD50 pKa = 3.71DD51 pKa = 4.76RR52 pKa = 11.84GAEE55 pKa = 3.93IFTKK59 pKa = 10.37GQLVNPLHH67 pKa = 6.75KK68 pKa = 10.58LPSIKK73 pKa = 10.92SMVDD77 pKa = 2.6AAEE80 pKa = 3.89RR81 pKa = 11.84SGRR84 pKa = 11.84LMQMHH89 pKa = 6.72RR90 pKa = 11.84QAQNLKK96 pKa = 10.16LAEE99 pKa = 5.12DD100 pKa = 5.21DD101 pKa = 5.56DD102 pKa = 5.8PDD104 pKa = 3.79FQGYY108 pKa = 8.93DD109 pKa = 3.65RR110 pKa = 11.84NWLEE114 pKa = 4.09EE115 pKa = 4.0NFVTEE120 pKa = 4.71FEE122 pKa = 4.38FEE124 pKa = 4.2FMRR127 pKa = 11.84EE128 pKa = 3.9RR129 pKa = 11.84LPVSAPSQPAPDD141 pKa = 3.87APKK144 pKa = 9.89EE145 pKa = 4.32VPATTPADD153 pKa = 3.76KK154 pKa = 10.76ADD156 pKa = 4.36PPPASSNADD165 pKa = 3.06
MM1 pKa = 6.67THH3 pKa = 5.37VSKK6 pKa = 10.8FIEE9 pKa = 4.62APQDD13 pKa = 3.77PEE15 pKa = 5.6DD16 pKa = 4.29LLQPSYY22 pKa = 11.57AVVNPKK28 pKa = 9.23TGALKK33 pKa = 10.17EE34 pKa = 4.37YY35 pKa = 7.76PACMAPIAADD45 pKa = 3.55AQRR48 pKa = 11.84LDD50 pKa = 3.71DD51 pKa = 4.76RR52 pKa = 11.84GAEE55 pKa = 3.93IFTKK59 pKa = 10.37GQLVNPLHH67 pKa = 6.75KK68 pKa = 10.58LPSIKK73 pKa = 10.92SMVDD77 pKa = 2.6AAEE80 pKa = 3.89RR81 pKa = 11.84SGRR84 pKa = 11.84LMQMHH89 pKa = 6.72RR90 pKa = 11.84QAQNLKK96 pKa = 10.16LAEE99 pKa = 5.12DD100 pKa = 5.21DD101 pKa = 5.56DD102 pKa = 5.8PDD104 pKa = 3.79FQGYY108 pKa = 8.93DD109 pKa = 3.65RR110 pKa = 11.84NWLEE114 pKa = 4.09EE115 pKa = 4.0NFVTEE120 pKa = 4.71FEE122 pKa = 4.38FEE124 pKa = 4.2FMRR127 pKa = 11.84EE128 pKa = 3.9RR129 pKa = 11.84LPVSAPSQPAPDD141 pKa = 3.87APKK144 pKa = 9.89EE145 pKa = 4.32VPATTPADD153 pKa = 3.76KK154 pKa = 10.76ADD156 pKa = 4.36PPPASSNADD165 pKa = 3.06
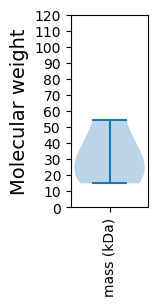
Molecular weight: 18.29 kDa
Isoelectric point according different methods:
Protein with the highest isoelectric point:
>tr|A0A3S8UTM5|A0A3S8UTM5_9VIRU Uncharacterized protein OS=Apis mellifera associated microvirus 37 OX=2494766 PE=4 SV=1
MM1 pKa = 7.51ARR3 pKa = 11.84RR4 pKa = 11.84GRR6 pKa = 11.84SKK8 pKa = 10.79SSRR11 pKa = 11.84TKK13 pKa = 8.93SSRR16 pKa = 11.84RR17 pKa = 11.84RR18 pKa = 11.84AYY20 pKa = 10.03HH21 pKa = 6.45PPASLPRR28 pKa = 11.84LHH30 pKa = 6.84RR31 pKa = 11.84RR32 pKa = 11.84YY33 pKa = 10.75DD34 pKa = 3.67FAPTPSFDD42 pKa = 3.16TLYY45 pKa = 10.2PSRR48 pKa = 11.84PLRR51 pKa = 11.84RR52 pKa = 11.84PPVQRR57 pKa = 11.84FVFPARR63 pKa = 11.84VLTSPARR70 pKa = 11.84RR71 pKa = 11.84VASVPNRR78 pKa = 11.84YY79 pKa = 8.87IPKK82 pKa = 10.01LSVPVPRR89 pKa = 11.84ITIRR93 pKa = 11.84DD94 pKa = 3.68LVCAKK99 pKa = 9.97RR100 pKa = 11.84AIRR103 pKa = 11.84RR104 pKa = 11.84EE105 pKa = 3.85VLFASGKK112 pKa = 9.88GGSKK116 pKa = 9.18VARR119 pKa = 11.84PKK121 pKa = 9.29FTSVSKK127 pKa = 10.62IKK129 pKa = 10.78CC130 pKa = 3.37
MM1 pKa = 7.51ARR3 pKa = 11.84RR4 pKa = 11.84GRR6 pKa = 11.84SKK8 pKa = 10.79SSRR11 pKa = 11.84TKK13 pKa = 8.93SSRR16 pKa = 11.84RR17 pKa = 11.84RR18 pKa = 11.84AYY20 pKa = 10.03HH21 pKa = 6.45PPASLPRR28 pKa = 11.84LHH30 pKa = 6.84RR31 pKa = 11.84RR32 pKa = 11.84YY33 pKa = 10.75DD34 pKa = 3.67FAPTPSFDD42 pKa = 3.16TLYY45 pKa = 10.2PSRR48 pKa = 11.84PLRR51 pKa = 11.84RR52 pKa = 11.84PPVQRR57 pKa = 11.84FVFPARR63 pKa = 11.84VLTSPARR70 pKa = 11.84RR71 pKa = 11.84VASVPNRR78 pKa = 11.84YY79 pKa = 8.87IPKK82 pKa = 10.01LSVPVPRR89 pKa = 11.84ITIRR93 pKa = 11.84DD94 pKa = 3.68LVCAKK99 pKa = 9.97RR100 pKa = 11.84AIRR103 pKa = 11.84RR104 pKa = 11.84EE105 pKa = 3.85VLFASGKK112 pKa = 9.88GGSKK116 pKa = 9.18VARR119 pKa = 11.84PKK121 pKa = 9.29FTSVSKK127 pKa = 10.62IKK129 pKa = 10.78CC130 pKa = 3.37
Molecular weight: 14.82 kDa
Isoelectric point according different methods:
Peptides (in silico digests for buttom-up proteomics)
Below you can find in silico digests of the whole proteome with Trypsin, Chymotrypsin, Trypsin+LysC, LysN, ArgC proteases suitable for different mass spec machines.| Try ESI |
 |
|---|
| ChTry ESI |
 |
|---|
| ArgC ESI |
 |
|---|
| LysN ESI |
 |
|---|
| TryLysC ESI |
 |
|---|
| Try MALDI |
 |
|---|
| ChTry MALDI |
 |
|---|
| ArgC MALDI |
 |
|---|
| LysN MALDI |
 |
|---|
| TryLysC MALDI |
 |
|---|
| Try LTQ |
 |
|---|
| ChTry LTQ |
 |
|---|
| ArgC LTQ |
 |
|---|
| LysN LTQ |
 |
|---|
| TryLysC LTQ |
 |
|---|
| Try MSlow |
 |
|---|
| ChTry MSlow |
 |
|---|
| ArgC MSlow |
 |
|---|
| LysN MSlow |
 |
|---|
| TryLysC MSlow |
 |
|---|
| Try MShigh |
 |
|---|
| ChTry MShigh |
 |
|---|
| ArgC MShigh |
 |
|---|
| LysN MShigh |
 |
|---|
| TryLysC MShigh |
 |
|---|
General Statistics
Number of major isoforms |
Number of additional isoforms |
Number of all proteins |
Number of amino acids |
Min. Seq. Length |
Max. Seq. Length |
Avg. Seq. Length |
Avg. Mol. Weight |
|---|---|---|---|---|---|---|---|
0 |
1365 |
130 |
480 |
273.0 |
30.75 |
Amino acid frequency
Ala |
Cys |
Asp |
Glu |
Phe |
Gly |
His |
Ile |
Lys |
Leu |
|---|---|---|---|---|---|---|---|---|---|
7.399 ± 1.602 | 0.733 ± 0.3 |
5.788 ± 0.83 | 4.762 ± 0.689 |
4.176 ± 0.553 | 7.253 ± 1.283 |
2.711 ± 0.269 | 4.469 ± 0.474 |
5.421 ± 0.569 | 9.304 ± 0.812 |
Met |
Asn |
Gln |
Pro |
Arg |
Ser |
Thr |
Val |
Trp |
Tyr |
|---|---|---|---|---|---|---|---|---|---|
2.491 ± 0.315 | 3.736 ± 0.785 |
7.106 ± 1.28 | 4.615 ± 0.633 |
7.179 ± 1.827 | 6.593 ± 0.88 |
5.275 ± 0.395 | 5.788 ± 0.469 |
1.538 ± 0.403 | 3.663 ± 0.567 |
Most of the basic statistics you can see at this page can be downloaded from this CSV file
Proteome-pI is available under Creative Commons Attribution-NoDerivs license, for more details see here
| Reference: Kozlowski LP. Proteome-pI 2.0: Proteome Isoelectric Point Database Update. Nucleic Acids Res. 2021, doi: 10.1093/nar/gkab944 | Contact: Lukasz P. Kozlowski |
