Candidatus Phytoplasma solani
Taxonomy: cellular organisms; Bacteria; Terrabacteria group; Tenericutes; Mollicutes; Acholeplasmatales; Acholeplasmataceae; Candidatus Phytoplasma; 16SrXII (Stolbur group)
Average proteome isoelectric point is 8.06
Get precalculated fractions of proteins
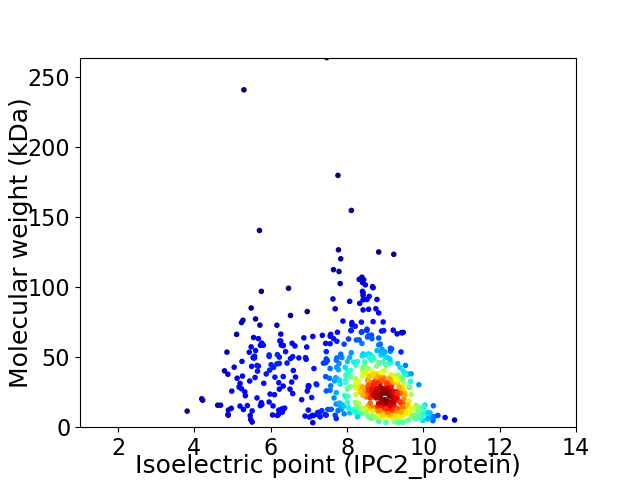
Virtual 2D-PAGE plot for 631 proteins (isoelectric point calculated using IPC2_protein)
Get csv file with sequences according to given criteria:
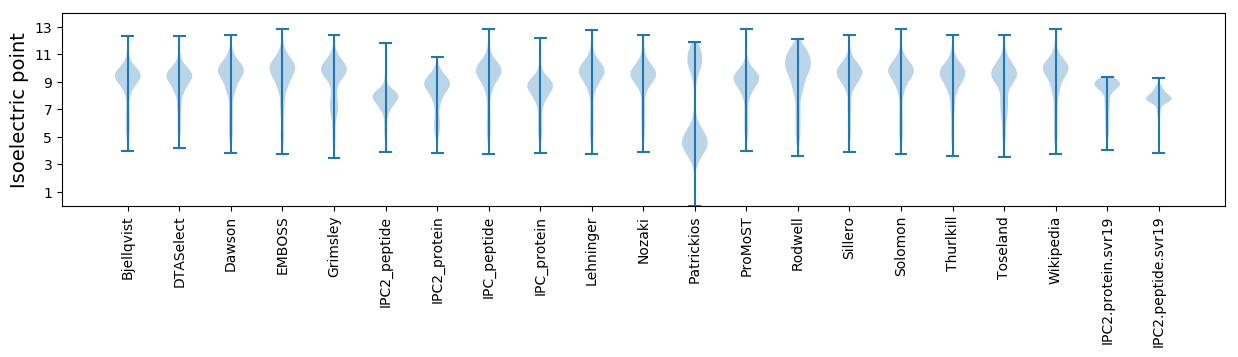
* You can choose from 21 different methods for calculating isoelectric point
Summary statistics related to proteome-wise predictions
Protein with the lowest isoelectric point:
>tr|A0A421NUU5|A0A421NUU5_9MOLU Uncharacterized protein OS=Candidatus Phytoplasma solani OX=69896 GN=PSSA1_v1c5670 PE=4 SV=1
MM1 pKa = 7.21QKK3 pKa = 10.55AKK5 pKa = 10.29EE6 pKa = 4.12YY7 pKa = 8.64QTTYY11 pKa = 9.28YY12 pKa = 10.38QPDD15 pKa = 4.18GTTVDD20 pKa = 4.5YY21 pKa = 9.48ITEE24 pKa = 4.52FDD26 pKa = 3.54PSTRR30 pKa = 11.84KK31 pKa = 9.07IVKK34 pKa = 8.61ATIFQQDD41 pKa = 3.5GTTVDD46 pKa = 4.39SISDD50 pKa = 4.02FDD52 pKa = 4.44PSTGEE57 pKa = 3.82PVKK60 pKa = 8.89TTTYY64 pKa = 10.63QDD66 pKa = 3.57DD67 pKa = 3.98GTTVDD72 pKa = 5.78FISDD76 pKa = 4.2FDD78 pKa = 4.33PSTGEE83 pKa = 3.83LVKK86 pKa = 8.92TTFYY90 pKa = 10.99QSDD93 pKa = 3.59GTIFDD98 pKa = 4.82IINFF102 pKa = 3.86
MM1 pKa = 7.21QKK3 pKa = 10.55AKK5 pKa = 10.29EE6 pKa = 4.12YY7 pKa = 8.64QTTYY11 pKa = 9.28YY12 pKa = 10.38QPDD15 pKa = 4.18GTTVDD20 pKa = 4.5YY21 pKa = 9.48ITEE24 pKa = 4.52FDD26 pKa = 3.54PSTRR30 pKa = 11.84KK31 pKa = 9.07IVKK34 pKa = 8.61ATIFQQDD41 pKa = 3.5GTTVDD46 pKa = 4.39SISDD50 pKa = 4.02FDD52 pKa = 4.44PSTGEE57 pKa = 3.82PVKK60 pKa = 8.89TTTYY64 pKa = 10.63QDD66 pKa = 3.57DD67 pKa = 3.98GTTVDD72 pKa = 5.78FISDD76 pKa = 4.2FDD78 pKa = 4.33PSTGEE83 pKa = 3.83LVKK86 pKa = 8.92TTFYY90 pKa = 10.99QSDD93 pKa = 3.59GTIFDD98 pKa = 4.82IINFF102 pKa = 3.86
Molecular weight: 11.48 kDa
Isoelectric point according different methods:
Protein with the highest isoelectric point:
>tr|A0A421NUL7|A0A421NUL7_9MOLU Putative transposase OS=Candidatus Phytoplasma solani OX=69896 GN=tra5 PE=4 SV=1
MM1 pKa = 7.09KK2 pKa = 10.0QVHH5 pKa = 5.52YY6 pKa = 10.4CGTGRR11 pKa = 11.84RR12 pKa = 11.84KK13 pKa = 9.97SAVARR18 pKa = 11.84VILTNGTGQITINTKK33 pKa = 9.66NFEE36 pKa = 4.38SYY38 pKa = 11.02LPLPATRR45 pKa = 11.84LDD47 pKa = 3.43MLQPLTVTDD56 pKa = 3.22KK57 pKa = 11.39RR58 pKa = 11.84EE59 pKa = 4.16AYY61 pKa = 9.84DD62 pKa = 3.2VRR64 pKa = 11.84VNVNGGGLCAQAGAIRR80 pKa = 11.84LGIARR85 pKa = 11.84ALLEE89 pKa = 4.82SIPEE93 pKa = 3.8LRR95 pKa = 11.84TILKK99 pKa = 10.16KK100 pKa = 10.77AGLLTRR106 pKa = 11.84DD107 pKa = 3.44ARR109 pKa = 11.84CVEE112 pKa = 4.03RR113 pKa = 11.84KK114 pKa = 10.02KK115 pKa = 11.23YY116 pKa = 10.13GLKK119 pKa = 9.63KK120 pKa = 10.31ARR122 pKa = 11.84RR123 pKa = 11.84APQFSKK129 pKa = 10.95RR130 pKa = 3.57
MM1 pKa = 7.09KK2 pKa = 10.0QVHH5 pKa = 5.52YY6 pKa = 10.4CGTGRR11 pKa = 11.84RR12 pKa = 11.84KK13 pKa = 9.97SAVARR18 pKa = 11.84VILTNGTGQITINTKK33 pKa = 9.66NFEE36 pKa = 4.38SYY38 pKa = 11.02LPLPATRR45 pKa = 11.84LDD47 pKa = 3.43MLQPLTVTDD56 pKa = 3.22KK57 pKa = 11.39RR58 pKa = 11.84EE59 pKa = 4.16AYY61 pKa = 9.84DD62 pKa = 3.2VRR64 pKa = 11.84VNVNGGGLCAQAGAIRR80 pKa = 11.84LGIARR85 pKa = 11.84ALLEE89 pKa = 4.82SIPEE93 pKa = 3.8LRR95 pKa = 11.84TILKK99 pKa = 10.16KK100 pKa = 10.77AGLLTRR106 pKa = 11.84DD107 pKa = 3.44ARR109 pKa = 11.84CVEE112 pKa = 4.03RR113 pKa = 11.84KK114 pKa = 10.02KK115 pKa = 11.23YY116 pKa = 10.13GLKK119 pKa = 9.63KK120 pKa = 10.31ARR122 pKa = 11.84RR123 pKa = 11.84APQFSKK129 pKa = 10.95RR130 pKa = 3.57
Molecular weight: 14.42 kDa
Isoelectric point according different methods:
Peptides (in silico digests for buttom-up proteomics)
Below you can find in silico digests of the whole proteome with Trypsin, Chymotrypsin, Trypsin+LysC, LysN, ArgC proteases suitable for different mass spec machines.| Try ESI |
 |
|---|
| ChTry ESI |
|
|---|
| ArgC ESI |
|
|---|
| LysN ESI |
|
|---|
| TryLysC ESI |
|
|---|
| Try MALDI |
|
|---|
| ChTry MALDI |
|
|---|
| ArgC MALDI |
|
|---|
| LysN MALDI |
|
|---|
| TryLysC MALDI |
|
|---|
| Try LTQ |
|
|---|
| ChTry LTQ |
|
|---|
| ArgC LTQ |
|
|---|
| LysN LTQ |
|
|---|
| TryLysC LTQ |
|
|---|
| Try MSlow |
|
|---|
| ChTry MSlow |
|
|---|
| ArgC MSlow |
|
|---|
| LysN MSlow |
|
|---|
| TryLysC MSlow |
|
|---|
| Try MShigh |
|
|---|
| ChTry MShigh |
|
|---|
| ArgC MShigh |
|
|---|
| LysN MShigh |
|
|---|
| TryLysC MShigh |
|
|---|
General Statistics
Number of major isoforms |
Number of additional isoforms |
Number of all proteins |
Number of amino acids |
Min. Seq. Length |
Max. Seq. Length |
Avg. Seq. Length |
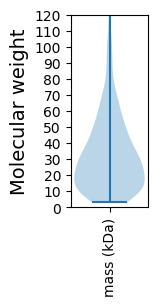
Avg. Mol. Weight |
|---|---|---|---|---|---|---|---|
0 |
190526 |
29 |
2236 |
301.9 |
34.8 |
Amino acid frequency
Ala |
Cys |
Asp |
Glu |
Phe |
Gly |
His |
Ile |
Lys |
Leu |
|---|---|---|---|---|---|---|---|---|---|
4.695 ± 0.095 | 0.932 ± 0.031 |
4.599 ± 0.06 | 6.109 ± 0.134 |
5.624 ± 0.108 | 4.313 ± 0.09 |
1.971 ± 0.047 | 9.412 ± 0.094 |
10.891 ± 0.118 | 10.529 ± 0.107 |
Met |
Asn |
Gln |
Pro |
Arg |
Ser |
Thr |
Val |
Trp |
Tyr |
|---|---|---|---|---|---|---|---|---|---|
1.713 ± 0.04 | 6.902 ± 0.103 |
3.165 ± 0.056 | 5.719 ± 0.139 |
2.793 ± 0.065 | 5.473 ± 0.055 |
6.011 ± 0.113 | 4.764 ± 0.092 |
0.621 ± 0.026 | 3.762 ± 0.077 |
Most of the basic statistics you can see at this page can be downloaded from this CSV file
See this proteome in:

Proteome-pI is available under Creative Commons Attribution-NoDerivs license, for more details see here
| Reference: Kozlowski LP. Proteome-pI 2.0: Proteome Isoelectric Point Database Update. Nucleic Acids Res. 2021, doi: 10.1093/nar/gkab944 | Contact: Lukasz P. Kozlowski |