Candidatus Pantoea carbekii
Taxonomy: cellular organisms; Bacteria; Proteobacteria; Gammaproteobacteria; Enterobacterales; Erwiniaceae; Pantoea
Average proteome isoelectric point is 7.6
Get precalculated fractions of proteins

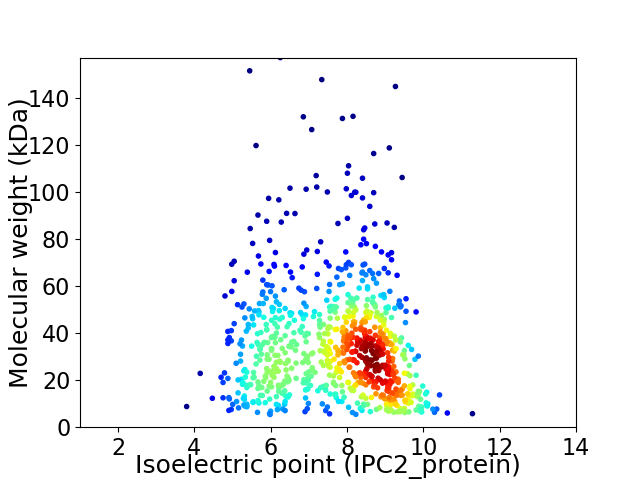
Virtual 2D-PAGE plot for 825 proteins (isoelectric point calculated using IPC2_protein)
Get csv file with sequences according to given criteria:
* You can choose from 21 different methods for calculating isoelectric point
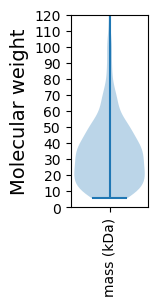
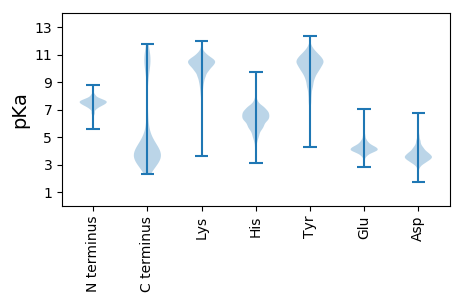
Summary statistics related to proteome-wise predictions


Protein with the lowest isoelectric point:
>tr|U3U2N1|U3U2N1_9GAMM Uracil-DNA glycosylase OS=Candidatus Pantoea carbekii OX=1235990 GN=ung PE=3 SV=1
MM1 pKa = 7.27VHH3 pKa = 7.37DD4 pKa = 4.17SQMDD8 pKa = 3.58LFDD11 pKa = 3.02IHH13 pKa = 6.63TGYY16 pKa = 11.12SSGIYY21 pKa = 10.0NLNQRR26 pKa = 11.84AWAEE30 pKa = 3.83QLYY33 pKa = 10.46LAICNYY39 pKa = 9.38IQQNLDD45 pKa = 3.22PSNRR49 pKa = 11.84AHH51 pKa = 6.8HH52 pKa = 5.92PVIDD56 pKa = 3.81KK57 pKa = 10.36LQEE60 pKa = 3.63RR61 pKa = 11.84MADD64 pKa = 3.36KK65 pKa = 10.52IYY67 pKa = 11.32VNFSLFQSMPDD78 pKa = 2.73AWGINQLFPVFPLEE92 pKa = 5.07GLNQTLKK99 pKa = 10.61RR100 pKa = 11.84RR101 pKa = 11.84AVLLDD106 pKa = 3.3ITCDD110 pKa = 3.06SDD112 pKa = 5.5GIIDD116 pKa = 4.49HH117 pKa = 6.94YY118 pKa = 11.27IDD120 pKa = 4.5GDD122 pKa = 4.36GIATTMPIADD132 pKa = 3.97YY133 pKa = 10.83DD134 pKa = 3.97INNPPLLGFFMAGAYY149 pKa = 9.43QKK151 pKa = 10.76ILGNMHH157 pKa = 6.7NLFGDD162 pKa = 4.22TEE164 pKa = 4.32AVNVFVFSNGNIEE177 pKa = 4.27IQLSDD182 pKa = 3.7QGDD185 pKa = 3.92TVADD189 pKa = 3.48MLQYY193 pKa = 10.67VQLNAADD200 pKa = 4.19LLII203 pKa = 5.01
MM1 pKa = 7.27VHH3 pKa = 7.37DD4 pKa = 4.17SQMDD8 pKa = 3.58LFDD11 pKa = 3.02IHH13 pKa = 6.63TGYY16 pKa = 11.12SSGIYY21 pKa = 10.0NLNQRR26 pKa = 11.84AWAEE30 pKa = 3.83QLYY33 pKa = 10.46LAICNYY39 pKa = 9.38IQQNLDD45 pKa = 3.22PSNRR49 pKa = 11.84AHH51 pKa = 6.8HH52 pKa = 5.92PVIDD56 pKa = 3.81KK57 pKa = 10.36LQEE60 pKa = 3.63RR61 pKa = 11.84MADD64 pKa = 3.36KK65 pKa = 10.52IYY67 pKa = 11.32VNFSLFQSMPDD78 pKa = 2.73AWGINQLFPVFPLEE92 pKa = 5.07GLNQTLKK99 pKa = 10.61RR100 pKa = 11.84RR101 pKa = 11.84AVLLDD106 pKa = 3.3ITCDD110 pKa = 3.06SDD112 pKa = 5.5GIIDD116 pKa = 4.49HH117 pKa = 6.94YY118 pKa = 11.27IDD120 pKa = 4.5GDD122 pKa = 4.36GIATTMPIADD132 pKa = 3.97YY133 pKa = 10.83DD134 pKa = 3.97INNPPLLGFFMAGAYY149 pKa = 9.43QKK151 pKa = 10.76ILGNMHH157 pKa = 6.7NLFGDD162 pKa = 4.22TEE164 pKa = 4.32AVNVFVFSNGNIEE177 pKa = 4.27IQLSDD182 pKa = 3.7QGDD185 pKa = 3.92TVADD189 pKa = 3.48MLQYY193 pKa = 10.67VQLNAADD200 pKa = 4.19LLII203 pKa = 5.01
Molecular weight: 22.86 kDa
Isoelectric point according different methods:
Protein with the highest isoelectric point:
>tr|U3U8X0|U3U8X0_9GAMM 2-oxoglutarate reductase OS=Candidatus Pantoea carbekii OX=1235990 GN=serA PE=3 SV=1
MM1 pKa = 7.45KK2 pKa = 9.53RR3 pKa = 11.84TFQPSILKK11 pKa = 10.32RR12 pKa = 11.84MRR14 pKa = 11.84SHH16 pKa = 7.02GFRR19 pKa = 11.84ARR21 pKa = 11.84MATKK25 pKa = 10.06HH26 pKa = 5.06GRR28 pKa = 11.84QIISRR33 pKa = 11.84RR34 pKa = 11.84RR35 pKa = 11.84AKK37 pKa = 9.97GRR39 pKa = 11.84RR40 pKa = 11.84RR41 pKa = 11.84LTVSSKK47 pKa = 10.12NN48 pKa = 3.47
MM1 pKa = 7.45KK2 pKa = 9.53RR3 pKa = 11.84TFQPSILKK11 pKa = 10.32RR12 pKa = 11.84MRR14 pKa = 11.84SHH16 pKa = 7.02GFRR19 pKa = 11.84ARR21 pKa = 11.84MATKK25 pKa = 10.06HH26 pKa = 5.06GRR28 pKa = 11.84QIISRR33 pKa = 11.84RR34 pKa = 11.84RR35 pKa = 11.84AKK37 pKa = 9.97GRR39 pKa = 11.84RR40 pKa = 11.84RR41 pKa = 11.84LTVSSKK47 pKa = 10.12NN48 pKa = 3.47
Molecular weight: 5.75 kDa
Isoelectric point according different methods:
Peptides (in silico digests for buttom-up proteomics)
Below you can find in silico digests of the whole proteome with Trypsin, Chymotrypsin, Trypsin+LysC, LysN, ArgC proteases suitable for different mass spec machines.| Try ESI |
 |
|---|
| ChTry ESI |
 |
|---|
| ArgC ESI |
 |
|---|
| LysN ESI |
 |
|---|
| TryLysC ESI |
 |
|---|
| Try MALDI |
 |
|---|
| ChTry MALDI |
 |
|---|
| ArgC MALDI |
 |
|---|
| LysN MALDI |
 |
|---|
| TryLysC MALDI |
 |
|---|
| Try LTQ |
 |
|---|
| ChTry LTQ |
 |
|---|
| ArgC LTQ |
 |
|---|
| LysN LTQ |
 |
|---|
| TryLysC LTQ |
 |
|---|
| Try MSlow |
 |
|---|
| ChTry MSlow |
 |
|---|
| ArgC MSlow |
 |
|---|
| LysN MSlow |
 |
|---|
| TryLysC MSlow |
 |
|---|
| Try MShigh |
 |
|---|
| ChTry MShigh |
 |
|---|
| ArgC MShigh |
 |
|---|
| LysN MShigh |
 |
|---|
| TryLysC MShigh |
 |
|---|
General Statistics
Number of major isoforms |
Number of additional isoforms |
Number of all proteins |
Number of amino acids |
Min. Seq. Length |
Max. Seq. Length |
Avg. Seq. Length |
Avg. Mol. Weight |
|---|---|---|---|---|---|---|---|
0 |
260910 |
45 |
1413 |
316.3 |
35.72 |
Amino acid frequency
Ala |
Cys |
Asp |
Glu |
Phe |
Gly |
His |
Ile |
Lys |
Leu |
|---|---|---|---|---|---|---|---|---|---|
6.593 ± 0.076 | 1.455 ± 0.033 |
4.548 ± 0.057 | 5.321 ± 0.075 |
4.18 ± 0.056 | 6.152 ± 0.061 |
2.528 ± 0.035 | 9.517 ± 0.077 |
6.465 ± 0.082 | 10.598 ± 0.085 |
Met |
Asn |
Gln |
Pro |
Arg |
Ser |
Thr |
Val |
Trp |
Tyr |
|---|---|---|---|---|---|---|---|---|---|
2.623 ± 0.037 | 5.64 ± 0.066 |
3.48 ± 0.037 | 4.035 ± 0.043 |
5.042 ± 0.05 | 6.216 ± 0.052 |
5.114 ± 0.045 | 5.981 ± 0.061 |
1.107 ± 0.033 | 3.405 ± 0.05 |
Most of the basic statistics you can see at this page can be downloaded from this CSV file
Proteome-pI is available under Creative Commons Attribution-NoDerivs license, for more details see here
| Reference: Kozlowski LP. Proteome-pI 2.0: Proteome Isoelectric Point Database Update. Nucleic Acids Res. 2021, doi: 10.1093/nar/gkab944 | Contact: Lukasz P. Kozlowski |
