Ralstonia phage RSS30
Taxonomy: Viruses; Monodnaviria; Loebvirae; Hofneiviricota; Faserviricetes; Tubulavirales; Inoviridae; unclassified Inoviridae
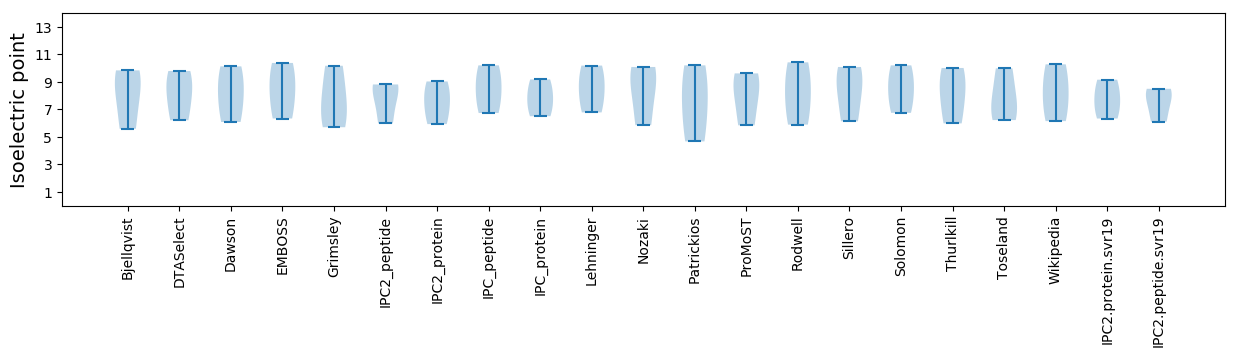
Average proteome isoelectric point is 7.73
Get precalculated fractions of proteins

Virtual 2D-PAGE plot for 3 proteins (isoelectric point calculated using IPC2_protein)
Get csv file with sequences according to given criteria:
* You can choose from 21 different methods for calculating isoelectric point
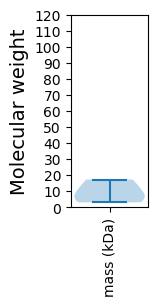
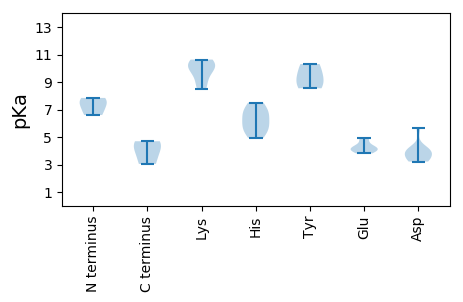
Summary statistics related to proteome-wise predictions
Protein with the lowest isoelectric point:
>tr|S6C3K7|S6C3K7_9VIRU Uncharacterized protein OS=Ralstonia phage RSS30 OX=1352227 PE=4 SV=1
MM1 pKa = 7.42LAIDD5 pKa = 4.08FWLWAGFLLPVLPAVIIFRR24 pKa = 11.84GLL26 pKa = 3.04
MM1 pKa = 7.42LAIDD5 pKa = 4.08FWLWAGFLLPVLPAVIIFRR24 pKa = 11.84GLL26 pKa = 3.04
Molecular weight: 2.97 kDa
Isoelectric point according different methods:
Protein with the highest isoelectric point:
>tr|S6B968|S6B968_9VIRU Uncharacterized protein OS=Ralstonia phage RSS30 OX=1352227 PE=4 SV=1
MM1 pKa = 7.84RR2 pKa = 11.84IEE4 pKa = 4.92KK5 pKa = 10.63YY6 pKa = 10.31LDD8 pKa = 3.22QAIEE12 pKa = 3.97RR13 pKa = 11.84HH14 pKa = 4.95GLKK17 pKa = 10.07NDD19 pKa = 3.29SKK21 pKa = 9.94LAEE24 pKa = 4.14MLGVVQSAVSHH35 pKa = 5.58YY36 pKa = 8.54RR37 pKa = 11.84TGRR40 pKa = 11.84RR41 pKa = 11.84TADD44 pKa = 3.23NEE46 pKa = 4.08VCLRR50 pKa = 11.84LAQLLEE56 pKa = 4.28MEE58 pKa = 4.78NPLPIIMAADD68 pKa = 3.4MDD70 pKa = 4.05RR71 pKa = 11.84AEE73 pKa = 4.39RR74 pKa = 11.84AGQHH78 pKa = 5.54SLWEE82 pKa = 4.24VFSTRR87 pKa = 11.84MAASNATAALLLVLVASATNFVAPSPAKK115 pKa = 10.1AAPLSHH121 pKa = 6.0STAQRR126 pKa = 11.84FVLCKK131 pKa = 8.49IARR134 pKa = 11.84RR135 pKa = 11.84LRR137 pKa = 11.84EE138 pKa = 3.81RR139 pKa = 11.84LQQALRR145 pKa = 11.84AVQTSPKK152 pKa = 9.14TAPCC156 pKa = 4.24
MM1 pKa = 7.84RR2 pKa = 11.84IEE4 pKa = 4.92KK5 pKa = 10.63YY6 pKa = 10.31LDD8 pKa = 3.22QAIEE12 pKa = 3.97RR13 pKa = 11.84HH14 pKa = 4.95GLKK17 pKa = 10.07NDD19 pKa = 3.29SKK21 pKa = 9.94LAEE24 pKa = 4.14MLGVVQSAVSHH35 pKa = 5.58YY36 pKa = 8.54RR37 pKa = 11.84TGRR40 pKa = 11.84RR41 pKa = 11.84TADD44 pKa = 3.23NEE46 pKa = 4.08VCLRR50 pKa = 11.84LAQLLEE56 pKa = 4.28MEE58 pKa = 4.78NPLPIIMAADD68 pKa = 3.4MDD70 pKa = 4.05RR71 pKa = 11.84AEE73 pKa = 4.39RR74 pKa = 11.84AGQHH78 pKa = 5.54SLWEE82 pKa = 4.24VFSTRR87 pKa = 11.84MAASNATAALLLVLVASATNFVAPSPAKK115 pKa = 10.1AAPLSHH121 pKa = 6.0STAQRR126 pKa = 11.84FVLCKK131 pKa = 8.49IARR134 pKa = 11.84RR135 pKa = 11.84LRR137 pKa = 11.84EE138 pKa = 3.81RR139 pKa = 11.84LQQALRR145 pKa = 11.84AVQTSPKK152 pKa = 9.14TAPCC156 pKa = 4.24
Molecular weight: 17.22 kDa
Isoelectric point according different methods:
Peptides (in silico digests for buttom-up proteomics)
Below you can find in silico digests of the whole proteome with Trypsin, Chymotrypsin, Trypsin+LysC, LysN, ArgC proteases suitable for different mass spec machines.| Try ESI |
 |
|---|
| ChTry ESI |
|
|---|
| ArgC ESI |
|
|---|
| LysN ESI |
|
|---|
| TryLysC ESI |
|
|---|
| Try MALDI |
|
|---|
| ChTry MALDI |
|
|---|
| ArgC MALDI |
|
|---|
| LysN MALDI |
|
|---|
| TryLysC MALDI |
|
|---|
| Try LTQ |
|
|---|
| ChTry LTQ |
|
|---|
| ArgC LTQ |
|
|---|
| LysN LTQ |
|
|---|
| TryLysC LTQ |
|
|---|
| Try MSlow |
|
|---|
| ChTry MSlow |
|
|---|
| ArgC MSlow |
|
|---|
| LysN MSlow |
|
|---|
| TryLysC MSlow |
|
|---|
| Try MShigh |
|
|---|
| ChTry MShigh |
|
|---|
| ArgC MShigh |
|
|---|
| LysN MShigh |
|
|---|
| TryLysC MShigh |
|
|---|
General Statistics
Number of major isoforms |
Number of additional isoforms |
Number of all proteins |
Number of amino acids |
Min. Seq. Length |
Max. Seq. Length |
Avg. Seq. Length |
Avg. Mol. Weight |
|---|---|---|---|---|---|---|---|
0 |
250 |
26 |
156 |
83.3 |
9.3 |
Amino acid frequency
Ala |
Cys |
Asp |
Glu |
Phe |
Gly |
His |
Ile |
Lys |
Leu |
|---|---|---|---|---|---|---|---|---|---|
14.8 ± 1.165 | 2.4 ± 0.856 |
4.8 ± 1.565 | 4.0 ± 1.619 |
2.4 ± 2.206 | 4.0 ± 1.352 |
3.2 ± 1.141 | 4.4 ± 1.785 |
2.8 ± 0.996 | 13.6 ± 2.329 |
Met |
Asn |
Gln |
Pro |
Arg |
Ser |
Thr |
Val |
Trp |
Tyr |
|---|---|---|---|---|---|---|---|---|---|
4.0 ± 0.159 | 2.8 ± 0.685 |
4.4 ± 0.86 | 5.6 ± 1.607 |
9.6 ± 1.448 | 5.2 ± 1.788 |
3.2 ± 1.7 | 6.0 ± 0.655 |
1.6 ± 1.508 | 1.2 ± 0.288 |
Most of the basic statistics you can see at this page can be downloaded from this CSV file
See this proteome in:

Proteome-pI is available under Creative Commons Attribution-NoDerivs license, for more details see here
| Reference: Kozlowski LP. Proteome-pI 2.0: Proteome Isoelectric Point Database Update. Nucleic Acids Res. 2021, doi: 10.1093/nar/gkab944 | Contact: Lukasz P. Kozlowski |