Desulfurococcus amylolyticus (strain DSM 18924 / JCM 16383 / VKM B-2413 / 1221n) (Desulfurococcus kamchatkensis)
Taxonomy: cellular organisms; Archaea; TACK group; Crenarchaeota; Thermoprotei; Desulfurococcales; Desulfurococcaceae; Desulfurococcus; Desulfurococcus amylolyticus
Average proteome isoelectric point is 6.99
Get precalculated fractions of proteins

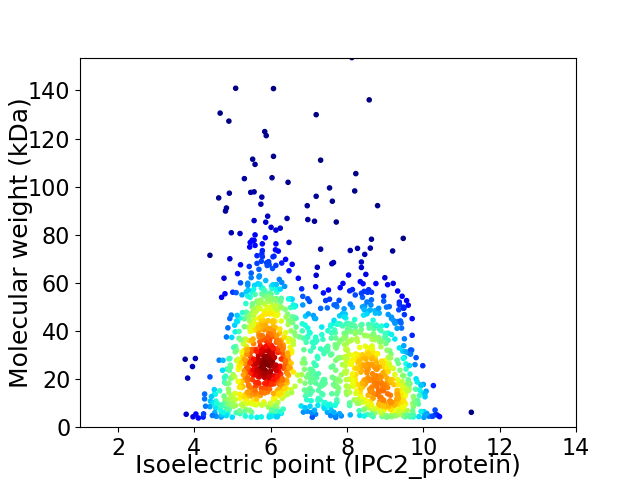
Virtual 2D-PAGE plot for 1470 proteins (isoelectric point calculated using IPC2_protein)
Get csv file with sequences according to given criteria:
* You can choose from 21 different methods for calculating isoelectric point
Summary statistics related to proteome-wise predictions


Protein with the lowest isoelectric point:
>tr|B8D556|B8D556_DESA1 Aspartate--tRNA ligase OS=Desulfurococcus amylolyticus (strain DSM 18924 / JCM 16383 / VKM B-2413 / 1221n) OX=490899 GN=aspS PE=3 SV=1
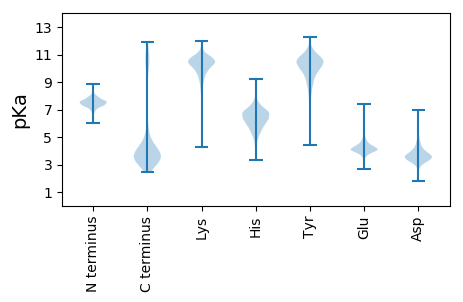
MM1 pKa = 7.46KK2 pKa = 10.45ALNTVMGLALAGLAILALGTAMAMWYY28 pKa = 7.16EE29 pKa = 4.15TLRR32 pKa = 11.84VNTYY36 pKa = 10.41VEE38 pKa = 4.03TGEE41 pKa = 5.04VKK43 pKa = 10.63VAWADD48 pKa = 3.58WQCSDD53 pKa = 5.16EE54 pKa = 5.39GPDD57 pKa = 3.71PQLPDD62 pKa = 3.39SDD64 pKa = 3.88FHH66 pKa = 7.98NDD68 pKa = 2.96EE69 pKa = 4.66GKK71 pKa = 10.26DD72 pKa = 3.45VAQCIVEE79 pKa = 4.03PEE81 pKa = 4.3VYY83 pKa = 10.14DD84 pKa = 4.08GEE86 pKa = 4.58GNAVKK91 pKa = 10.94VNITLMNAYY100 pKa = 9.17PGYY103 pKa = 10.69NPVITLTVEE112 pKa = 4.28NIGTIPVKK120 pKa = 10.54LLNYY124 pKa = 10.15DD125 pKa = 3.89LTDD128 pKa = 3.45GGYY131 pKa = 10.74DD132 pKa = 3.45NQALSVTITVPEE144 pKa = 4.17DD145 pKa = 3.65TQLHH149 pKa = 6.48PEE151 pKa = 4.29GTHH154 pKa = 7.52DD155 pKa = 3.22ITINIAVLQTASEE168 pKa = 4.33DD169 pKa = 3.49STYY172 pKa = 11.42SFGLEE177 pKa = 3.43FTYY180 pKa = 10.6AQWNEE185 pKa = 4.04VPP187 pKa = 4.45
MM1 pKa = 7.46KK2 pKa = 10.45ALNTVMGLALAGLAILALGTAMAMWYY28 pKa = 7.16EE29 pKa = 4.15TLRR32 pKa = 11.84VNTYY36 pKa = 10.41VEE38 pKa = 4.03TGEE41 pKa = 5.04VKK43 pKa = 10.63VAWADD48 pKa = 3.58WQCSDD53 pKa = 5.16EE54 pKa = 5.39GPDD57 pKa = 3.71PQLPDD62 pKa = 3.39SDD64 pKa = 3.88FHH66 pKa = 7.98NDD68 pKa = 2.96EE69 pKa = 4.66GKK71 pKa = 10.26DD72 pKa = 3.45VAQCIVEE79 pKa = 4.03PEE81 pKa = 4.3VYY83 pKa = 10.14DD84 pKa = 4.08GEE86 pKa = 4.58GNAVKK91 pKa = 10.94VNITLMNAYY100 pKa = 9.17PGYY103 pKa = 10.69NPVITLTVEE112 pKa = 4.28NIGTIPVKK120 pKa = 10.54LLNYY124 pKa = 10.15DD125 pKa = 3.89LTDD128 pKa = 3.45GGYY131 pKa = 10.74DD132 pKa = 3.45NQALSVTITVPEE144 pKa = 4.17DD145 pKa = 3.65TQLHH149 pKa = 6.48PEE151 pKa = 4.29GTHH154 pKa = 7.52DD155 pKa = 3.22ITINIAVLQTASEE168 pKa = 4.33DD169 pKa = 3.49STYY172 pKa = 11.42SFGLEE177 pKa = 3.43FTYY180 pKa = 10.6AQWNEE185 pKa = 4.04VPP187 pKa = 4.45
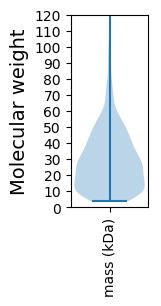
Molecular weight: 20.42 kDa
Isoelectric point according different methods:
Protein with the highest isoelectric point:
>tr|B8D5S3|B8D5S3_DESA1 Uncharacterized protein OS=Desulfurococcus amylolyticus (strain DSM 18924 / JCM 16383 / VKM B-2413 / 1221n) OX=490899 GN=DKAM_1128 PE=4 SV=1
MM1 pKa = 7.62ARR3 pKa = 11.84FKK5 pKa = 10.87HH6 pKa = 5.09VARR9 pKa = 11.84KK10 pKa = 9.39LRR12 pKa = 11.84LAAALKK18 pKa = 10.32SNRR21 pKa = 11.84AIPIWVSAKK30 pKa = 8.5TRR32 pKa = 11.84LRR34 pKa = 11.84VRR36 pKa = 11.84RR37 pKa = 11.84GFSLRR42 pKa = 11.84NWRR45 pKa = 11.84RR46 pKa = 11.84SKK48 pKa = 10.85LKK50 pKa = 10.81NII52 pKa = 4.23
MM1 pKa = 7.62ARR3 pKa = 11.84FKK5 pKa = 10.87HH6 pKa = 5.09VARR9 pKa = 11.84KK10 pKa = 9.39LRR12 pKa = 11.84LAAALKK18 pKa = 10.32SNRR21 pKa = 11.84AIPIWVSAKK30 pKa = 8.5TRR32 pKa = 11.84LRR34 pKa = 11.84VRR36 pKa = 11.84RR37 pKa = 11.84GFSLRR42 pKa = 11.84NWRR45 pKa = 11.84RR46 pKa = 11.84SKK48 pKa = 10.85LKK50 pKa = 10.81NII52 pKa = 4.23
Molecular weight: 6.2 kDa
Isoelectric point according different methods:
Peptides (in silico digests for buttom-up proteomics)
Below you can find in silico digests of the whole proteome with Trypsin, Chymotrypsin, Trypsin+LysC, LysN, ArgC proteases suitable for different mass spec machines.| Try ESI |
 |
|---|
| ChTry ESI |
 |
|---|
| ArgC ESI |
 |
|---|
| LysN ESI |
 |
|---|
| TryLysC ESI |
 |
|---|
| Try MALDI |
 |
|---|
| ChTry MALDI |
 |
|---|
| ArgC MALDI |
 |
|---|
| LysN MALDI |
 |
|---|
| TryLysC MALDI |
 |
|---|
| Try LTQ |
 |
|---|
| ChTry LTQ |
 |
|---|
| ArgC LTQ |
 |
|---|
| LysN LTQ |
 |
|---|
| TryLysC LTQ |
 |
|---|
| Try MSlow |
 |
|---|
| ChTry MSlow |
 |
|---|
| ArgC MSlow |
 |
|---|
| LysN MSlow |
 |
|---|
| TryLysC MSlow |
 |
|---|
| Try MShigh |
 |
|---|
| ChTry MShigh |
 |
|---|
| ArgC MShigh |
 |
|---|
| LysN MShigh |
 |
|---|
| TryLysC MShigh |
 |
|---|
General Statistics
Number of major isoforms |
Number of additional isoforms |
Number of all proteins |
Number of amino acids |
Min. Seq. Length |
Max. Seq. Length |
Avg. Seq. Length |
Avg. Mol. Weight |
|---|---|---|---|---|---|---|---|
0 |
400476 |
37 |
1334 |
272.4 |
30.54 |
Amino acid frequency
Ala |
Cys |
Asp |
Glu |
Phe |
Gly |
His |
Ile |
Lys |
Leu |
|---|---|---|---|---|---|---|---|---|---|
6.578 ± 0.067 | 0.738 ± 0.019 |
4.552 ± 0.042 | 7.139 ± 0.08 |
3.262 ± 0.039 | 7.382 ± 0.05 |
1.669 ± 0.03 | 8.511 ± 0.065 |
5.799 ± 0.067 | 10.68 ± 0.074 |
Met |
Asn |
Gln |
Pro |
Arg |
Ser |
Thr |
Val |
Trp |
Tyr |
|---|---|---|---|---|---|---|---|---|---|
2.339 ± 0.022 | 3.462 ± 0.04 |
4.489 ± 0.038 | 1.731 ± 0.023 |
6.192 ± 0.063 | 6.468 ± 0.064 |
4.79 ± 0.061 | 8.574 ± 0.057 |
1.097 ± 0.025 | 4.547 ± 0.053 |
Most of the basic statistics you can see at this page can be downloaded from this CSV file
Proteome-pI is available under Creative Commons Attribution-NoDerivs license, for more details see here
| Reference: Kozlowski LP. Proteome-pI 2.0: Proteome Isoelectric Point Database Update. Nucleic Acids Res. 2021, doi: 10.1093/nar/gkab944 | Contact: Lukasz P. Kozlowski |
