Klamath virus
Taxonomy: Viruses; Riboviria; Orthornavirae; Negarnaviricota; Haploviricotina; Monjiviricetes; Mononegavirales; Rhabdoviridae; Alpharhabdovirinae; Tupavirus; Klamath tupavirus
Average proteome isoelectric point is 7.03
Get precalculated fractions of proteins

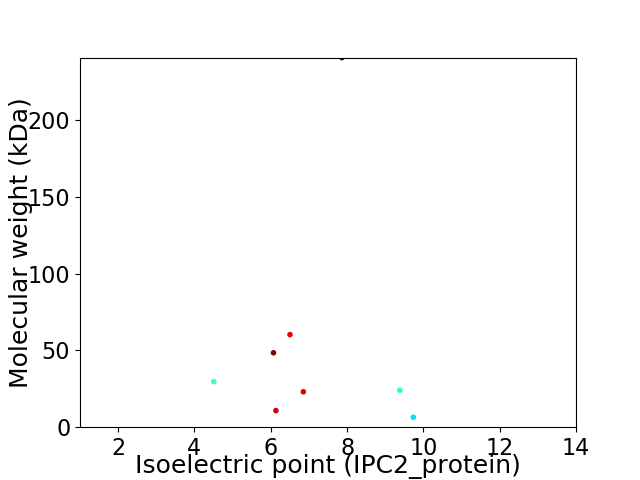
Virtual 2D-PAGE plot for 8 proteins (isoelectric point calculated using IPC2_protein)
Get csv file with sequences according to given criteria:
* You can choose from 21 different methods for calculating isoelectric point
Summary statistics related to proteome-wise predictions


Protein with the lowest isoelectric point:
>tr|A0A0D3R167|A0A0D3R167_9RHAB Nucleocapsid protein OS=Klamath virus OX=909206 PE=4 SV=1
MM1 pKa = 7.62EE2 pKa = 5.2KK3 pKa = 10.0RR4 pKa = 11.84VPSAVLANYY13 pKa = 9.66DD14 pKa = 3.73LSKK17 pKa = 11.04LQDD20 pKa = 3.63SLEE23 pKa = 4.16EE24 pKa = 4.48AEE26 pKa = 4.86GADD29 pKa = 3.75LSEE32 pKa = 4.21MEE34 pKa = 4.26RR35 pKa = 11.84DD36 pKa = 3.53KK37 pKa = 11.78GGSAQSNSSDD47 pKa = 2.96ILNLFDD53 pKa = 5.2PYY55 pKa = 11.45SPGGQSSEE63 pKa = 4.25LLFDD67 pKa = 3.85GLNPIKK73 pKa = 10.31IVAEE77 pKa = 4.13GDD79 pKa = 3.43KK80 pKa = 11.19SEE82 pKa = 4.8SNSDD86 pKa = 5.27DD87 pKa = 3.62EE88 pKa = 5.78DD89 pKa = 5.17ADD91 pKa = 4.2PGDD94 pKa = 4.19RR95 pKa = 11.84GADD98 pKa = 3.23SDD100 pKa = 4.09EE101 pKa = 4.69SSEE104 pKa = 4.34SEE106 pKa = 4.21SDD108 pKa = 3.27HH109 pKa = 7.49GPDD112 pKa = 4.16LSAINHH118 pKa = 6.05PPKK121 pKa = 10.84SRR123 pKa = 11.84DD124 pKa = 3.04NFFNINGPDD133 pKa = 3.31KK134 pKa = 11.06GPYY137 pKa = 8.84SLRR140 pKa = 11.84INPEE144 pKa = 3.94VLQSAPIDD152 pKa = 3.88GQLEE156 pKa = 4.21LLCEE160 pKa = 4.24LLHH163 pKa = 6.51EE164 pKa = 5.15LGTRR168 pKa = 11.84VGFSVKK174 pKa = 10.45ASGRR178 pKa = 11.84YY179 pKa = 8.15FAIDD183 pKa = 3.66KK184 pKa = 10.74IEE186 pKa = 4.24VPSSSIPPGPVQASGNVYY204 pKa = 10.34ARR206 pKa = 11.84YY207 pKa = 9.66KK208 pKa = 10.54EE209 pKa = 3.89RR210 pKa = 11.84LKK212 pKa = 11.3VGFKK216 pKa = 10.48YY217 pKa = 10.04PRR219 pKa = 11.84KK220 pKa = 9.94KK221 pKa = 10.85GGGLLLINEE230 pKa = 4.32EE231 pKa = 4.3SFNVGSLPEE240 pKa = 5.39DD241 pKa = 3.02IFAGQNFKK249 pKa = 10.22TPEE252 pKa = 3.84EE253 pKa = 4.13VLRR256 pKa = 11.84FALARR261 pKa = 11.84KK262 pKa = 9.13GVLAYY267 pKa = 9.87VQTMADD273 pKa = 3.36LL274 pKa = 4.3
MM1 pKa = 7.62EE2 pKa = 5.2KK3 pKa = 10.0RR4 pKa = 11.84VPSAVLANYY13 pKa = 9.66DD14 pKa = 3.73LSKK17 pKa = 11.04LQDD20 pKa = 3.63SLEE23 pKa = 4.16EE24 pKa = 4.48AEE26 pKa = 4.86GADD29 pKa = 3.75LSEE32 pKa = 4.21MEE34 pKa = 4.26RR35 pKa = 11.84DD36 pKa = 3.53KK37 pKa = 11.78GGSAQSNSSDD47 pKa = 2.96ILNLFDD53 pKa = 5.2PYY55 pKa = 11.45SPGGQSSEE63 pKa = 4.25LLFDD67 pKa = 3.85GLNPIKK73 pKa = 10.31IVAEE77 pKa = 4.13GDD79 pKa = 3.43KK80 pKa = 11.19SEE82 pKa = 4.8SNSDD86 pKa = 5.27DD87 pKa = 3.62EE88 pKa = 5.78DD89 pKa = 5.17ADD91 pKa = 4.2PGDD94 pKa = 4.19RR95 pKa = 11.84GADD98 pKa = 3.23SDD100 pKa = 4.09EE101 pKa = 4.69SSEE104 pKa = 4.34SEE106 pKa = 4.21SDD108 pKa = 3.27HH109 pKa = 7.49GPDD112 pKa = 4.16LSAINHH118 pKa = 6.05PPKK121 pKa = 10.84SRR123 pKa = 11.84DD124 pKa = 3.04NFFNINGPDD133 pKa = 3.31KK134 pKa = 11.06GPYY137 pKa = 8.84SLRR140 pKa = 11.84INPEE144 pKa = 3.94VLQSAPIDD152 pKa = 3.88GQLEE156 pKa = 4.21LLCEE160 pKa = 4.24LLHH163 pKa = 6.51EE164 pKa = 5.15LGTRR168 pKa = 11.84VGFSVKK174 pKa = 10.45ASGRR178 pKa = 11.84YY179 pKa = 8.15FAIDD183 pKa = 3.66KK184 pKa = 10.74IEE186 pKa = 4.24VPSSSIPPGPVQASGNVYY204 pKa = 10.34ARR206 pKa = 11.84YY207 pKa = 9.66KK208 pKa = 10.54EE209 pKa = 3.89RR210 pKa = 11.84LKK212 pKa = 11.3VGFKK216 pKa = 10.48YY217 pKa = 10.04PRR219 pKa = 11.84KK220 pKa = 9.94KK221 pKa = 10.85GGGLLLINEE230 pKa = 4.32EE231 pKa = 4.3SFNVGSLPEE240 pKa = 5.39DD241 pKa = 3.02IFAGQNFKK249 pKa = 10.22TPEE252 pKa = 3.84EE253 pKa = 4.13VLRR256 pKa = 11.84FALARR261 pKa = 11.84KK262 pKa = 9.13GVLAYY267 pKa = 9.87VQTMADD273 pKa = 3.36LL274 pKa = 4.3
Molecular weight: 29.68 kDa
Isoelectric point according different methods:
Protein with the highest isoelectric point:
>tr|A0A0D3R1B1|A0A0D3R1B1_9RHAB GDP polyribonucleotidyltransferase OS=Klamath virus OX=909206 PE=4 SV=1
MM1 pKa = 7.97RR2 pKa = 11.84CRR4 pKa = 11.84PNCPICRR11 pKa = 11.84LRR13 pKa = 11.84AGPRR17 pKa = 11.84IWIRR21 pKa = 11.84DD22 pKa = 3.81MVRR25 pKa = 11.84GDD27 pKa = 4.2PPPLNPQPGDD37 pKa = 3.49YY38 pKa = 10.86LFVRR42 pKa = 11.84VPFPPYY48 pKa = 9.64WLRR51 pKa = 11.84LKK53 pKa = 10.65YY54 pKa = 10.52
MM1 pKa = 7.97RR2 pKa = 11.84CRR4 pKa = 11.84PNCPICRR11 pKa = 11.84LRR13 pKa = 11.84AGPRR17 pKa = 11.84IWIRR21 pKa = 11.84DD22 pKa = 3.81MVRR25 pKa = 11.84GDD27 pKa = 4.2PPPLNPQPGDD37 pKa = 3.49YY38 pKa = 10.86LFVRR42 pKa = 11.84VPFPPYY48 pKa = 9.64WLRR51 pKa = 11.84LKK53 pKa = 10.65YY54 pKa = 10.52
Molecular weight: 6.49 kDa
Isoelectric point according different methods:
Peptides (in silico digests for buttom-up proteomics)
Below you can find in silico digests of the whole proteome with Trypsin, Chymotrypsin, Trypsin+LysC, LysN, ArgC proteases suitable for different mass spec machines.| Try ESI |
 |
|---|
| ChTry ESI |
 |
|---|
| ArgC ESI |
 |
|---|
| LysN ESI |
 |
|---|
| TryLysC ESI |
 |
|---|
| Try MALDI |
 |
|---|
| ChTry MALDI |
 |
|---|
| ArgC MALDI |
 |
|---|
| LysN MALDI |
 |
|---|
| TryLysC MALDI |
 |
|---|
| Try LTQ |
 |
|---|
| ChTry LTQ |
 |
|---|
| ArgC LTQ |
 |
|---|
| LysN LTQ |
 |
|---|
| TryLysC LTQ |
 |
|---|
| Try MSlow |
 |
|---|
| ChTry MSlow |
 |
|---|
| ArgC MSlow |
 |
|---|
| LysN MSlow |
 |
|---|
| TryLysC MSlow |
 |
|---|
| Try MShigh |
 |
|---|
| ChTry MShigh |
 |
|---|
| ArgC MShigh |
 |
|---|
| LysN MShigh |
 |
|---|
| TryLysC MShigh |
 |
|---|
General Statistics
Number of major isoforms |
Number of additional isoforms |
Number of all proteins |
Number of amino acids |
Min. Seq. Length |
Max. Seq. Length |
Avg. Seq. Length |
Avg. Mol. Weight |
|---|---|---|---|---|---|---|---|
0 |
3907 |
54 |
2107 |
488.4 |
55.49 |
Amino acid frequency
Ala |
Cys |
Asp |
Glu |
Phe |
Gly |
His |
Ile |
Lys |
Leu |
|---|---|---|---|---|---|---|---|---|---|
4.94 ± 0.716 | 1.689 ± 0.316 |
5.426 ± 0.421 | 5.554 ± 0.479 |
4.633 ± 0.42 | 6.168 ± 0.636 |
2.38 ± 0.443 | 5.708 ± 0.678 |
4.965 ± 0.37 | 11.851 ± 0.934 |
Met |
Asn |
Gln |
Pro |
Arg |
Ser |
Thr |
Val |
Trp |
Tyr |
|---|---|---|---|---|---|---|---|---|---|
2.355 ± 0.448 | 3.942 ± 0.359 |
5.708 ± 0.884 | 3.481 ± 0.539 |
6.476 ± 0.658 | 8.395 ± 0.852 |
5.298 ± 0.784 | 5.784 ± 0.694 |
1.817 ± 0.337 | 3.43 ± 0.314 |
Most of the basic statistics you can see at this page can be downloaded from this CSV file
Proteome-pI is available under Creative Commons Attribution-NoDerivs license, for more details see here
| Reference: Kozlowski LP. Proteome-pI 2.0: Proteome Isoelectric Point Database Update. Nucleic Acids Res. 2021, doi: 10.1093/nar/gkab944 | Contact: Lukasz P. Kozlowski |
