Streptococcus phage Javan278
Taxonomy: Viruses; Duplodnaviria; Heunggongvirae; Uroviricota; Caudoviricetes; Caudovirales; Siphoviridae; unclassified Siphoviridae
Average proteome isoelectric point is 6.76
Get precalculated fractions of proteins

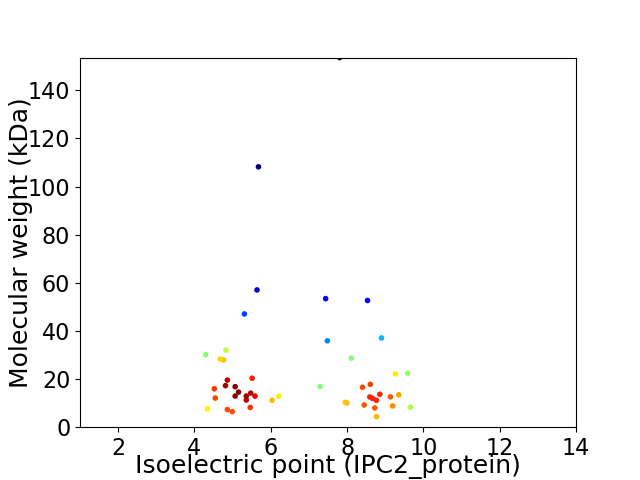
Virtual 2D-PAGE plot for 49 proteins (isoelectric point calculated using IPC2_protein)
Get csv file with sequences according to given criteria:
* You can choose from 21 different methods for calculating isoelectric point
Summary statistics related to proteome-wise predictions


Protein with the lowest isoelectric point:
>tr|A0A4D6AWW0|A0A4D6AWW0_9CAUD Uncharacterized protein OS=Streptococcus phage Javan278 OX=2548091 GN=Javan278_0037 PE=4 SV=1
MM1 pKa = 7.29SRR3 pKa = 11.84IEE5 pKa = 3.93SSIAEE10 pKa = 4.14MRR12 pKa = 11.84RR13 pKa = 11.84LQAIPVHH20 pKa = 7.21YY21 pKa = 10.96DD22 pKa = 2.56MGDD25 pKa = 3.2RR26 pKa = 11.84YY27 pKa = 11.27GNDD30 pKa = 3.11ADD32 pKa = 3.64GDD34 pKa = 3.77EE35 pKa = 4.77RR36 pKa = 11.84IEE38 pKa = 4.08YY39 pKa = 9.82DD40 pKa = 3.4CSSSVSQALGLSLNNNTEE58 pKa = 4.33TLKK61 pKa = 11.4SNLPKK66 pKa = 10.19INYY69 pKa = 7.9NCVYY73 pKa = 10.38DD74 pKa = 4.46GVDD77 pKa = 3.32GSIDD81 pKa = 3.6FEE83 pKa = 4.67YY84 pKa = 11.16GDD86 pKa = 3.68VAIWSPRR93 pKa = 11.84DD94 pKa = 3.44GSSSLGAFGHH104 pKa = 4.99VVIMTGPTTMIHH116 pKa = 6.52CSYY119 pKa = 10.39GYY121 pKa = 10.67DD122 pKa = 3.65GIVEE126 pKa = 4.08SDD128 pKa = 3.82YY129 pKa = 11.11NQIWEE134 pKa = 4.27LNGRR138 pKa = 11.84PRR140 pKa = 11.84EE141 pKa = 4.09TVFRR145 pKa = 11.84EE146 pKa = 3.83NGQAAAPQPAPLTNKK161 pKa = 9.79SQNLKK166 pKa = 10.0IYY168 pKa = 10.5RR169 pKa = 11.84VDD171 pKa = 3.98DD172 pKa = 3.84LQFVNGIWQVRR183 pKa = 11.84CNDD186 pKa = 3.84LVPVEE191 pKa = 5.35FDD193 pKa = 2.83WTDD196 pKa = 2.99NGIACEE202 pKa = 5.02DD203 pKa = 3.48IDD205 pKa = 5.68LVDD208 pKa = 3.74EE209 pKa = 4.77NGNLLADD216 pKa = 3.58QEE218 pKa = 4.52TRR220 pKa = 11.84AGSLFVINPNKK231 pKa = 9.88VVSDD235 pKa = 3.89GEE237 pKa = 4.24GAYY240 pKa = 10.46GSGNYY245 pKa = 7.3YY246 pKa = 8.19WRR248 pKa = 11.84NVEE251 pKa = 4.21LSASGRR257 pKa = 11.84VWLSVWSVDD266 pKa = 4.32HH267 pKa = 6.81LLHH270 pKa = 6.9GG271 pKa = 4.49
MM1 pKa = 7.29SRR3 pKa = 11.84IEE5 pKa = 3.93SSIAEE10 pKa = 4.14MRR12 pKa = 11.84RR13 pKa = 11.84LQAIPVHH20 pKa = 7.21YY21 pKa = 10.96DD22 pKa = 2.56MGDD25 pKa = 3.2RR26 pKa = 11.84YY27 pKa = 11.27GNDD30 pKa = 3.11ADD32 pKa = 3.64GDD34 pKa = 3.77EE35 pKa = 4.77RR36 pKa = 11.84IEE38 pKa = 4.08YY39 pKa = 9.82DD40 pKa = 3.4CSSSVSQALGLSLNNNTEE58 pKa = 4.33TLKK61 pKa = 11.4SNLPKK66 pKa = 10.19INYY69 pKa = 7.9NCVYY73 pKa = 10.38DD74 pKa = 4.46GVDD77 pKa = 3.32GSIDD81 pKa = 3.6FEE83 pKa = 4.67YY84 pKa = 11.16GDD86 pKa = 3.68VAIWSPRR93 pKa = 11.84DD94 pKa = 3.44GSSSLGAFGHH104 pKa = 4.99VVIMTGPTTMIHH116 pKa = 6.52CSYY119 pKa = 10.39GYY121 pKa = 10.67DD122 pKa = 3.65GIVEE126 pKa = 4.08SDD128 pKa = 3.82YY129 pKa = 11.11NQIWEE134 pKa = 4.27LNGRR138 pKa = 11.84PRR140 pKa = 11.84EE141 pKa = 4.09TVFRR145 pKa = 11.84EE146 pKa = 3.83NGQAAAPQPAPLTNKK161 pKa = 9.79SQNLKK166 pKa = 10.0IYY168 pKa = 10.5RR169 pKa = 11.84VDD171 pKa = 3.98DD172 pKa = 3.84LQFVNGIWQVRR183 pKa = 11.84CNDD186 pKa = 3.84LVPVEE191 pKa = 5.35FDD193 pKa = 2.83WTDD196 pKa = 2.99NGIACEE202 pKa = 5.02DD203 pKa = 3.48IDD205 pKa = 5.68LVDD208 pKa = 3.74EE209 pKa = 4.77NGNLLADD216 pKa = 3.58QEE218 pKa = 4.52TRR220 pKa = 11.84AGSLFVINPNKK231 pKa = 9.88VVSDD235 pKa = 3.89GEE237 pKa = 4.24GAYY240 pKa = 10.46GSGNYY245 pKa = 7.3YY246 pKa = 8.19WRR248 pKa = 11.84NVEE251 pKa = 4.21LSASGRR257 pKa = 11.84VWLSVWSVDD266 pKa = 4.32HH267 pKa = 6.81LLHH270 pKa = 6.9GG271 pKa = 4.49
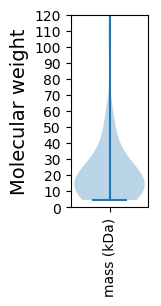
Molecular weight: 30.11 kDa
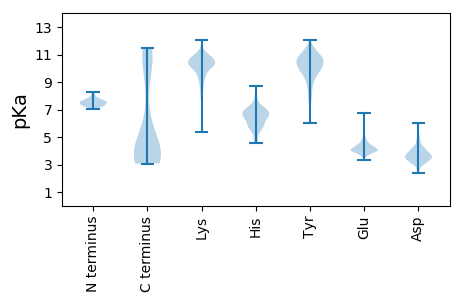
Isoelectric point according different methods:
Protein with the highest isoelectric point:
>tr|A0A4D6B1G5|A0A4D6B1G5_9CAUD HNH homing endonuclease OS=Streptococcus phage Javan278 OX=2548091 GN=Javan278_0024 PE=4 SV=1
MM1 pKa = 7.55KK2 pKa = 10.47FKK4 pKa = 11.11LNRR7 pKa = 11.84AGVADD12 pKa = 4.27LMKK15 pKa = 10.38SGAMQTVLNKK25 pKa = 10.0HH26 pKa = 6.06ASNIKK31 pKa = 9.22NRR33 pKa = 11.84CGDD36 pKa = 3.36GYY38 pKa = 10.92EE39 pKa = 3.66QDD41 pKa = 3.71VYY43 pKa = 11.4VGRR46 pKa = 11.84NRR48 pKa = 11.84ANAMVSAKK56 pKa = 6.74TTKK59 pKa = 10.26AKK61 pKa = 10.39KK62 pKa = 10.37DD63 pKa = 3.41NLKK66 pKa = 11.11NNTLLKK72 pKa = 10.42AVRR75 pKa = 3.79
MM1 pKa = 7.55KK2 pKa = 10.47FKK4 pKa = 11.11LNRR7 pKa = 11.84AGVADD12 pKa = 4.27LMKK15 pKa = 10.38SGAMQTVLNKK25 pKa = 10.0HH26 pKa = 6.06ASNIKK31 pKa = 9.22NRR33 pKa = 11.84CGDD36 pKa = 3.36GYY38 pKa = 10.92EE39 pKa = 3.66QDD41 pKa = 3.71VYY43 pKa = 11.4VGRR46 pKa = 11.84NRR48 pKa = 11.84ANAMVSAKK56 pKa = 6.74TTKK59 pKa = 10.26AKK61 pKa = 10.39KK62 pKa = 10.37DD63 pKa = 3.41NLKK66 pKa = 11.11NNTLLKK72 pKa = 10.42AVRR75 pKa = 3.79
Molecular weight: 8.3 kDa
Isoelectric point according different methods:
Peptides (in silico digests for buttom-up proteomics)
Below you can find in silico digests of the whole proteome with Trypsin, Chymotrypsin, Trypsin+LysC, LysN, ArgC proteases suitable for different mass spec machines.| Try ESI |
 |
|---|
| ChTry ESI |
 |
|---|
| ArgC ESI |
 |
|---|
| LysN ESI |
 |
|---|
| TryLysC ESI |
 |
|---|
| Try MALDI |
 |
|---|
| ChTry MALDI |
 |
|---|
| ArgC MALDI |
 |
|---|
| LysN MALDI |
 |
|---|
| TryLysC MALDI |
 |
|---|
| Try LTQ |
 |
|---|
| ChTry LTQ |
 |
|---|
| ArgC LTQ |
 |
|---|
| LysN LTQ |
 |
|---|
| TryLysC LTQ |
 |
|---|
| Try MSlow |
 |
|---|
| ChTry MSlow |
 |
|---|
| ArgC MSlow |
 |
|---|
| LysN MSlow |
 |
|---|
| TryLysC MSlow |
 |
|---|
| Try MShigh |
 |
|---|
| ChTry MShigh |
 |
|---|
| ArgC MShigh |
 |
|---|
| LysN MShigh |
 |
|---|
| TryLysC MShigh |
 |
|---|
General Statistics
Number of major isoforms |
Number of additional isoforms |
Number of all proteins |
Number of amino acids |
Min. Seq. Length |
Max. Seq. Length |
Avg. Seq. Length |
Avg. Mol. Weight |
|---|---|---|---|---|---|---|---|
0 |
10208 |
37 |
1368 |
208.3 |
23.61 |
Amino acid frequency
Ala |
Cys |
Asp |
Glu |
Phe |
Gly |
His |
Ile |
Lys |
Leu |
|---|---|---|---|---|---|---|---|---|---|
6.946 ± 0.589 | 0.764 ± 0.136 |
6.23 ± 0.312 | 6.985 ± 0.411 |
4.212 ± 0.247 | 6.593 ± 0.511 |
1.528 ± 0.218 | 7.024 ± 0.472 |
8.63 ± 0.448 | 8.023 ± 0.233 |
Met |
Asn |
Gln |
Pro |
Arg |
Ser |
Thr |
Val |
Trp |
Tyr |
|---|---|---|---|---|---|---|---|---|---|
2.194 ± 0.188 | 6.132 ± 0.26 |
2.87 ± 0.241 | 4.026 ± 0.225 |
4.545 ± 0.349 | 5.956 ± 0.348 |
5.408 ± 0.383 | 6.563 ± 0.259 |
1.567 ± 0.147 | 3.801 ± 0.29 |
Most of the basic statistics you can see at this page can be downloaded from this CSV file
Proteome-pI is available under Creative Commons Attribution-NoDerivs license, for more details see here
| Reference: Kozlowski LP. Proteome-pI 2.0: Proteome Isoelectric Point Database Update. Nucleic Acids Res. 2021, doi: 10.1093/nar/gkab944 | Contact: Lukasz P. Kozlowski |
