Candidatus Thioglobus singularis PS1
Taxonomy: cellular organisms; Bacteria; Proteobacteria; Gammaproteobacteria; Gammaproteobacteria incertae sedis; Candidatus Pseudothioglobus; Candidatus Pseudothioglobus singularis
Average proteome isoelectric point is 6.13
Get precalculated fractions of proteins

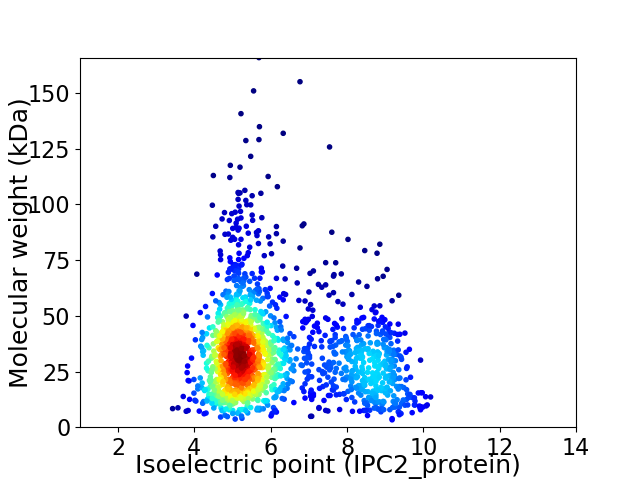
Virtual 2D-PAGE plot for 1681 proteins (isoelectric point calculated using IPC2_protein)
Get csv file with sequences according to given criteria:
* You can choose from 21 different methods for calculating isoelectric point
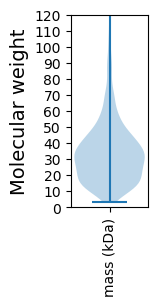
Summary statistics related to proteome-wise predictions


Protein with the lowest isoelectric point:
>tr|A0A0M3T2H1|A0A0M3T2H1_9GAMM Uncharacterized protein OS=Candidatus Thioglobus singularis PS1 OX=1125411 GN=W908_05475 PE=4 SV=1
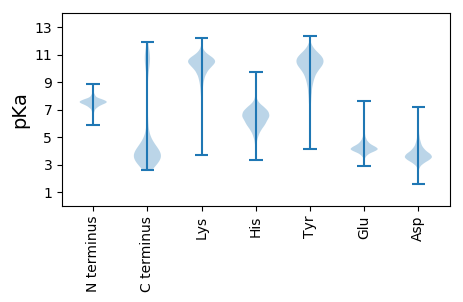
MM1 pKa = 7.37QINIISKK8 pKa = 10.69LITPVLLIVFLTSCSPSNVEE28 pKa = 3.6VSIYY32 pKa = 8.15TTDD35 pKa = 3.07IDD37 pKa = 3.97VAQEE41 pKa = 4.4GEE43 pKa = 4.41VLEE46 pKa = 4.53VPVMASFSLYY56 pKa = 10.64SDD58 pKa = 4.28DD59 pKa = 5.9DD60 pKa = 4.61GEE62 pKa = 4.88LEE64 pKa = 4.27SASQIAEE71 pKa = 4.24KK72 pKa = 10.87YY73 pKa = 9.12LAPDD77 pKa = 4.09SIFSQSSGDD86 pKa = 3.23WGEE89 pKa = 4.04TLVIEE94 pKa = 4.52TTIPMGTLDD103 pKa = 4.01SLQNYY108 pKa = 7.44LASNNRR114 pKa = 11.84VAVLLVQGVDD124 pKa = 3.62EE125 pKa = 4.88IEE127 pKa = 4.38ISLSSTDD134 pKa = 3.53YY135 pKa = 11.76ADD137 pKa = 4.07ALNSEE142 pKa = 4.35LTDD145 pKa = 3.38INFMLGFEE153 pKa = 4.79LPGDD157 pKa = 3.75STNFRR162 pKa = 11.84VISDD166 pKa = 3.5SRR168 pKa = 11.84NEE170 pKa = 4.0VQVDD174 pKa = 3.67ATAVFVSEE182 pKa = 4.81KK183 pKa = 10.28PYY185 pKa = 10.72LYY187 pKa = 10.23YY188 pKa = 10.99SKK190 pKa = 10.78VLKK193 pKa = 10.59RR194 pKa = 11.84RR195 pKa = 11.84DD196 pKa = 3.16EE197 pKa = 4.16AEE199 pKa = 3.79IVFKK203 pKa = 10.45GTTDD207 pKa = 3.14SVYY210 pKa = 11.11SEE212 pKa = 4.67INPLIYY218 pKa = 10.02INYY221 pKa = 8.19PP222 pKa = 3.14
MM1 pKa = 7.37QINIISKK8 pKa = 10.69LITPVLLIVFLTSCSPSNVEE28 pKa = 3.6VSIYY32 pKa = 8.15TTDD35 pKa = 3.07IDD37 pKa = 3.97VAQEE41 pKa = 4.4GEE43 pKa = 4.41VLEE46 pKa = 4.53VPVMASFSLYY56 pKa = 10.64SDD58 pKa = 4.28DD59 pKa = 5.9DD60 pKa = 4.61GEE62 pKa = 4.88LEE64 pKa = 4.27SASQIAEE71 pKa = 4.24KK72 pKa = 10.87YY73 pKa = 9.12LAPDD77 pKa = 4.09SIFSQSSGDD86 pKa = 3.23WGEE89 pKa = 4.04TLVIEE94 pKa = 4.52TTIPMGTLDD103 pKa = 4.01SLQNYY108 pKa = 7.44LASNNRR114 pKa = 11.84VAVLLVQGVDD124 pKa = 3.62EE125 pKa = 4.88IEE127 pKa = 4.38ISLSSTDD134 pKa = 3.53YY135 pKa = 11.76ADD137 pKa = 4.07ALNSEE142 pKa = 4.35LTDD145 pKa = 3.38INFMLGFEE153 pKa = 4.79LPGDD157 pKa = 3.75STNFRR162 pKa = 11.84VISDD166 pKa = 3.5SRR168 pKa = 11.84NEE170 pKa = 4.0VQVDD174 pKa = 3.67ATAVFVSEE182 pKa = 4.81KK183 pKa = 10.28PYY185 pKa = 10.72LYY187 pKa = 10.23YY188 pKa = 10.99SKK190 pKa = 10.78VLKK193 pKa = 10.59RR194 pKa = 11.84RR195 pKa = 11.84DD196 pKa = 3.16EE197 pKa = 4.16AEE199 pKa = 3.79IVFKK203 pKa = 10.45GTTDD207 pKa = 3.14SVYY210 pKa = 11.11SEE212 pKa = 4.67INPLIYY218 pKa = 10.02INYY221 pKa = 8.19PP222 pKa = 3.14
Molecular weight: 24.52 kDa
Isoelectric point according different methods:
Protein with the highest isoelectric point:
>tr|A0A0M3T1N4|A0A0M3T1N4_9GAMM Probable GTP-binding protein EngB OS=Candidatus Thioglobus singularis PS1 OX=1125411 GN=engB PE=3 SV=1
MM1 pKa = 7.43ARR3 pKa = 11.84IAGINIPTNKK13 pKa = 9.87HH14 pKa = 4.63IVIGLQSIFGIGEE27 pKa = 4.0TRR29 pKa = 11.84SKK31 pKa = 10.49QICEE35 pKa = 3.95ALKK38 pKa = 10.53LDD40 pKa = 4.21PSTKK44 pKa = 10.09VSALTEE50 pKa = 4.22DD51 pKa = 3.34QLEE54 pKa = 4.61SIRR57 pKa = 11.84TAVAQYY63 pKa = 10.2EE64 pKa = 4.51VEE66 pKa = 4.09GDD68 pKa = 3.55LRR70 pKa = 11.84RR71 pKa = 11.84EE72 pKa = 3.7VAMSIKK78 pKa = 10.33RR79 pKa = 11.84LRR81 pKa = 11.84DD82 pKa = 3.19LGCYY86 pKa = 9.55RR87 pKa = 11.84GIRR90 pKa = 11.84HH91 pKa = 6.47RR92 pKa = 11.84KK93 pKa = 8.06GLPLRR98 pKa = 11.84GQRR101 pKa = 11.84TKK103 pKa = 10.83TNARR107 pKa = 11.84TRR109 pKa = 11.84KK110 pKa = 9.41GPRR113 pKa = 11.84RR114 pKa = 11.84LIKK117 pKa = 10.58
MM1 pKa = 7.43ARR3 pKa = 11.84IAGINIPTNKK13 pKa = 9.87HH14 pKa = 4.63IVIGLQSIFGIGEE27 pKa = 4.0TRR29 pKa = 11.84SKK31 pKa = 10.49QICEE35 pKa = 3.95ALKK38 pKa = 10.53LDD40 pKa = 4.21PSTKK44 pKa = 10.09VSALTEE50 pKa = 4.22DD51 pKa = 3.34QLEE54 pKa = 4.61SIRR57 pKa = 11.84TAVAQYY63 pKa = 10.2EE64 pKa = 4.51VEE66 pKa = 4.09GDD68 pKa = 3.55LRR70 pKa = 11.84RR71 pKa = 11.84EE72 pKa = 3.7VAMSIKK78 pKa = 10.33RR79 pKa = 11.84LRR81 pKa = 11.84DD82 pKa = 3.19LGCYY86 pKa = 9.55RR87 pKa = 11.84GIRR90 pKa = 11.84HH91 pKa = 6.47RR92 pKa = 11.84KK93 pKa = 8.06GLPLRR98 pKa = 11.84GQRR101 pKa = 11.84TKK103 pKa = 10.83TNARR107 pKa = 11.84TRR109 pKa = 11.84KK110 pKa = 9.41GPRR113 pKa = 11.84RR114 pKa = 11.84LIKK117 pKa = 10.58
Molecular weight: 13.19 kDa
Isoelectric point according different methods:
Peptides (in silico digests for buttom-up proteomics)
Below you can find in silico digests of the whole proteome with Trypsin, Chymotrypsin, Trypsin+LysC, LysN, ArgC proteases suitable for different mass spec machines.| Try ESI |
 |
|---|
| ChTry ESI |
 |
|---|
| ArgC ESI |
 |
|---|
| LysN ESI |
 |
|---|
| TryLysC ESI |
 |
|---|
| Try MALDI |
 |
|---|
| ChTry MALDI |
 |
|---|
| ArgC MALDI |
 |
|---|
| LysN MALDI |
 |
|---|
| TryLysC MALDI |
 |
|---|
| Try LTQ |
 |
|---|
| ChTry LTQ |
 |
|---|
| ArgC LTQ |
 |
|---|
| LysN LTQ |
 |
|---|
| TryLysC LTQ |
 |
|---|
| Try MSlow |
 |
|---|
| ChTry MSlow |
 |
|---|
| ArgC MSlow |
 |
|---|
| LysN MSlow |
 |
|---|
| TryLysC MSlow |
 |
|---|
| Try MShigh |
 |
|---|
| ChTry MShigh |
 |
|---|
| ArgC MShigh |
 |
|---|
| LysN MShigh |
 |
|---|
| TryLysC MShigh |
 |
|---|
General Statistics
Number of major isoforms |
Number of additional isoforms |
Number of all proteins |
Number of amino acids |
Min. Seq. Length |
Max. Seq. Length |
Avg. Seq. Length |
Avg. Mol. Weight |
|---|---|---|---|---|---|---|---|
0 |
526563 |
32 |
1505 |
313.2 |
34.85 |
Amino acid frequency
Ala |
Cys |
Asp |
Glu |
Phe |
Gly |
His |
Ile |
Lys |
Leu |
|---|---|---|---|---|---|---|---|---|---|
7.095 ± 0.063 | 1.054 ± 0.02 |
5.679 ± 0.046 | 6.412 ± 0.047 |
4.521 ± 0.05 | 6.91 ± 0.059 |
1.981 ± 0.024 | 8.051 ± 0.054 |
6.654 ± 0.058 | 9.792 ± 0.063 |
Met |
Asn |
Gln |
Pro |
Arg |
Ser |
Thr |
Val |
Trp |
Tyr |
|---|---|---|---|---|---|---|---|---|---|
2.678 ± 0.029 | 5.229 ± 0.047 |
3.584 ± 0.033 | 3.301 ± 0.032 |
3.712 ± 0.036 | 7.795 ± 0.054 |
4.888 ± 0.04 | 6.505 ± 0.054 |
1.094 ± 0.025 | 3.068 ± 0.028 |
Most of the basic statistics you can see at this page can be downloaded from this CSV file
Proteome-pI is available under Creative Commons Attribution-NoDerivs license, for more details see here
| Reference: Kozlowski LP. Proteome-pI 2.0: Proteome Isoelectric Point Database Update. Nucleic Acids Res. 2021, doi: 10.1093/nar/gkab944 | Contact: Lukasz P. Kozlowski |
