Bacteroides sp. CAG:754
Taxonomy: cellular organisms; Bacteria; FCB group; Bacteroidetes/Chlorobi group; Bacteroidetes; Bacteroidia; Bacteroidales; Bacteroidaceae; Bacteroides; environmental samples
Average proteome isoelectric point is 6.34
Get precalculated fractions of proteins
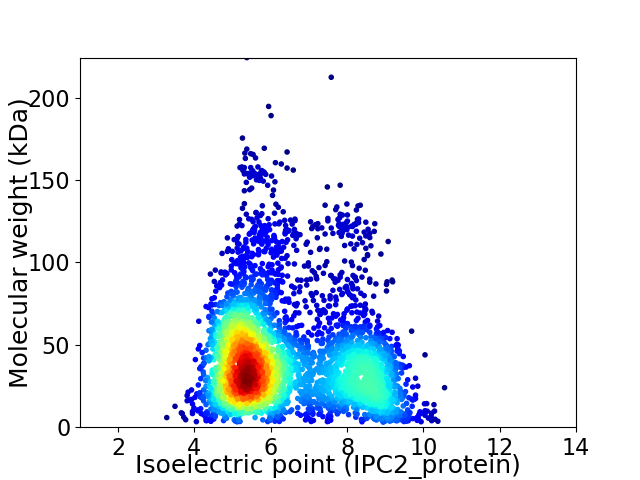
Virtual 2D-PAGE plot for 4054 proteins (isoelectric point calculated using IPC2_protein)
Get csv file with sequences according to given criteria:
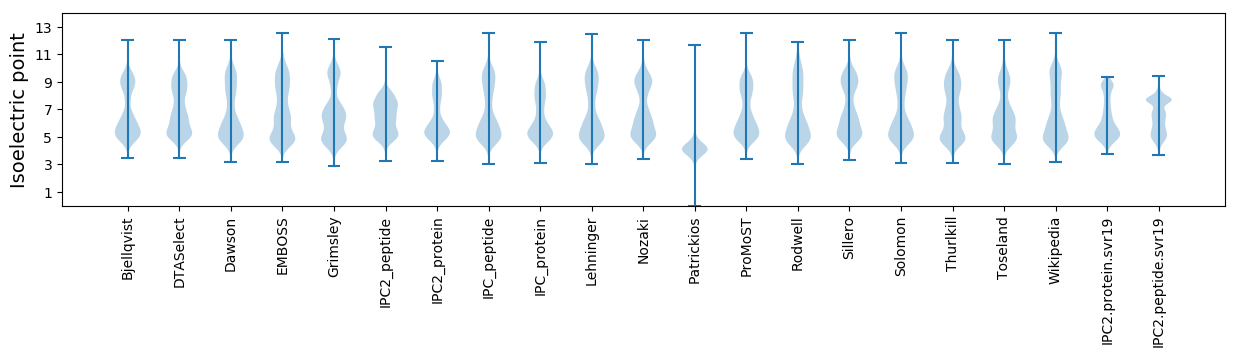
* You can choose from 21 different methods for calculating isoelectric point
Summary statistics related to proteome-wise predictions
Protein with the lowest isoelectric point:
>tr|R6DIU5|R6DIU5_9BACE TPR_REGION domain-containing protein OS=Bacteroides sp. CAG:754 OX=1262750 GN=BN772_00208 PE=4 SV=1
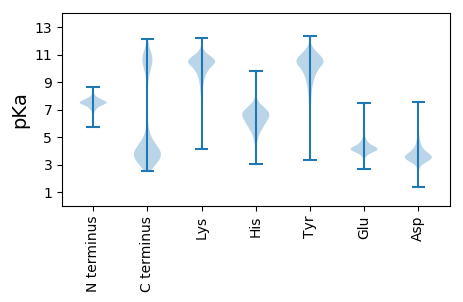
MM1 pKa = 7.67WKK3 pKa = 10.32FKK5 pKa = 10.37FGAWAVVLMMTALSFSACSDD25 pKa = 3.96DD26 pKa = 5.9DD27 pKa = 5.11DD28 pKa = 6.57DD29 pKa = 5.02PALVPPSNITEE40 pKa = 4.2ALKK43 pKa = 10.48QLYY46 pKa = 8.51PAAQNIEE53 pKa = 3.84WEE55 pKa = 4.47MKK57 pKa = 9.48GDD59 pKa = 4.09YY60 pKa = 10.28YY61 pKa = 11.67VADD64 pKa = 3.66CWVTGDD70 pKa = 4.82EE71 pKa = 4.31LDD73 pKa = 3.44VWFDD77 pKa = 4.11ANANWVMTEE86 pKa = 4.01NEE88 pKa = 4.68LNSIDD93 pKa = 3.83QLVPAVYY100 pKa = 8.52TAFQNSDD107 pKa = 2.85YY108 pKa = 10.49SAWVVTDD115 pKa = 3.8VYY117 pKa = 11.62VLTYY121 pKa = 7.88PQNMTEE127 pKa = 4.63SVIQVKK133 pKa = 10.34LGSQRR138 pKa = 11.84YY139 pKa = 8.37SLYY142 pKa = 10.29FSQEE146 pKa = 3.14GGLLHH151 pKa = 7.08KK152 pKa = 10.44KK153 pKa = 10.31DD154 pKa = 3.91ISNGDD159 pKa = 3.54DD160 pKa = 3.75TNWPPTEE167 pKa = 4.08NNN169 pKa = 3.11
MM1 pKa = 7.67WKK3 pKa = 10.32FKK5 pKa = 10.37FGAWAVVLMMTALSFSACSDD25 pKa = 3.96DD26 pKa = 5.9DD27 pKa = 5.11DD28 pKa = 6.57DD29 pKa = 5.02PALVPPSNITEE40 pKa = 4.2ALKK43 pKa = 10.48QLYY46 pKa = 8.51PAAQNIEE53 pKa = 3.84WEE55 pKa = 4.47MKK57 pKa = 9.48GDD59 pKa = 4.09YY60 pKa = 10.28YY61 pKa = 11.67VADD64 pKa = 3.66CWVTGDD70 pKa = 4.82EE71 pKa = 4.31LDD73 pKa = 3.44VWFDD77 pKa = 4.11ANANWVMTEE86 pKa = 4.01NEE88 pKa = 4.68LNSIDD93 pKa = 3.83QLVPAVYY100 pKa = 8.52TAFQNSDD107 pKa = 2.85YY108 pKa = 10.49SAWVVTDD115 pKa = 3.8VYY117 pKa = 11.62VLTYY121 pKa = 7.88PQNMTEE127 pKa = 4.63SVIQVKK133 pKa = 10.34LGSQRR138 pKa = 11.84YY139 pKa = 8.37SLYY142 pKa = 10.29FSQEE146 pKa = 3.14GGLLHH151 pKa = 7.08KK152 pKa = 10.44KK153 pKa = 10.31DD154 pKa = 3.91ISNGDD159 pKa = 3.54DD160 pKa = 3.75TNWPPTEE167 pKa = 4.08NNN169 pKa = 3.11
Molecular weight: 19.19 kDa
Isoelectric point according different methods:
Protein with the highest isoelectric point:
>tr|R6DFJ4|R6DFJ4_9BACE OMP_b-brl domain-containing protein OS=Bacteroides sp. CAG:754 OX=1262750 GN=BN772_02114 PE=4 SV=1
MM1 pKa = 7.75HH2 pKa = 7.48IPSQTYY8 pKa = 9.15RR9 pKa = 11.84PRR11 pKa = 11.84IPEE14 pKa = 3.95TIVRR18 pKa = 11.84SEE20 pKa = 4.01HH21 pKa = 6.34RR22 pKa = 11.84CTIVTIIEE30 pKa = 4.01IQQITVIIRR39 pKa = 11.84ISPIDD44 pKa = 3.57IEE46 pKa = 4.3TGRR49 pKa = 11.84TFLILTVFRR58 pKa = 11.84FSAIGIAIGKK68 pKa = 8.93GRR70 pKa = 11.84SSKK73 pKa = 10.95LIFRR77 pKa = 11.84KK78 pKa = 8.04TICRR82 pKa = 11.84IAVHH86 pKa = 6.83CILITTEE93 pKa = 3.07IKK95 pKa = 10.15ARR97 pKa = 11.84YY98 pKa = 8.27GIHH101 pKa = 6.88HH102 pKa = 6.67MFVCEE107 pKa = 4.01KK108 pKa = 8.25FTKK111 pKa = 10.13RR112 pKa = 11.84RR113 pKa = 11.84GKK115 pKa = 10.08IPFIYY120 pKa = 8.43HH121 pKa = 5.65TLCQRR126 pKa = 11.84MSKK129 pKa = 10.27QSFLIFSHH137 pKa = 6.98IIKK140 pKa = 10.52LL141 pKa = 3.73
MM1 pKa = 7.75HH2 pKa = 7.48IPSQTYY8 pKa = 9.15RR9 pKa = 11.84PRR11 pKa = 11.84IPEE14 pKa = 3.95TIVRR18 pKa = 11.84SEE20 pKa = 4.01HH21 pKa = 6.34RR22 pKa = 11.84CTIVTIIEE30 pKa = 4.01IQQITVIIRR39 pKa = 11.84ISPIDD44 pKa = 3.57IEE46 pKa = 4.3TGRR49 pKa = 11.84TFLILTVFRR58 pKa = 11.84FSAIGIAIGKK68 pKa = 8.93GRR70 pKa = 11.84SSKK73 pKa = 10.95LIFRR77 pKa = 11.84KK78 pKa = 8.04TICRR82 pKa = 11.84IAVHH86 pKa = 6.83CILITTEE93 pKa = 3.07IKK95 pKa = 10.15ARR97 pKa = 11.84YY98 pKa = 8.27GIHH101 pKa = 6.88HH102 pKa = 6.67MFVCEE107 pKa = 4.01KK108 pKa = 8.25FTKK111 pKa = 10.13RR112 pKa = 11.84RR113 pKa = 11.84GKK115 pKa = 10.08IPFIYY120 pKa = 8.43HH121 pKa = 5.65TLCQRR126 pKa = 11.84MSKK129 pKa = 10.27QSFLIFSHH137 pKa = 6.98IIKK140 pKa = 10.52LL141 pKa = 3.73
Molecular weight: 16.45 kDa
Isoelectric point according different methods:
Peptides (in silico digests for buttom-up proteomics)
Below you can find in silico digests of the whole proteome with Trypsin, Chymotrypsin, Trypsin+LysC, LysN, ArgC proteases suitable for different mass spec machines.| Try ESI |
 |
|---|
| ChTry ESI |
|
|---|
| ArgC ESI |
|
|---|
| LysN ESI |
|
|---|
| TryLysC ESI |
|
|---|
| Try MALDI |
|
|---|
| ChTry MALDI |
|
|---|
| ArgC MALDI |
|
|---|
| LysN MALDI |
|
|---|
| TryLysC MALDI |
|
|---|
| Try LTQ |
|
|---|
| ChTry LTQ |
|
|---|
| ArgC LTQ |
|
|---|
| LysN LTQ |
|
|---|
| TryLysC LTQ |
|
|---|
| Try MSlow |
|
|---|
| ChTry MSlow |
|
|---|
| ArgC MSlow |
|
|---|
| LysN MSlow |
|
|---|
| TryLysC MSlow |
|
|---|
| Try MShigh |
|
|---|
| ChTry MShigh |
|
|---|
| ArgC MShigh |
|
|---|
| LysN MShigh |
|
|---|
| TryLysC MShigh |
|
|---|
General Statistics
Number of major isoforms |
Number of additional isoforms |
Number of all proteins |
Number of amino acids |
Min. Seq. Length |
Max. Seq. Length |
Avg. Seq. Length |
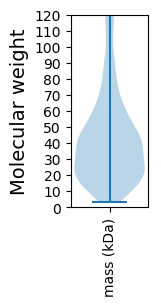
Avg. Mol. Weight |
|---|---|---|---|---|---|---|---|
0 |
1597693 |
29 |
1986 |
394.1 |
44.51 |
Amino acid frequency
Ala |
Cys |
Asp |
Glu |
Phe |
Gly |
His |
Ile |
Lys |
Leu |
|---|---|---|---|---|---|---|---|---|---|
6.849 ± 0.036 | 1.192 ± 0.014 |
5.557 ± 0.023 | 6.491 ± 0.034 |
4.584 ± 0.026 | 6.964 ± 0.031 |
1.776 ± 0.014 | 6.759 ± 0.035 |
6.619 ± 0.028 | 8.925 ± 0.038 |
Met |
Asn |
Gln |
Pro |
Arg |
Ser |
Thr |
Val |
Trp |
Tyr |
|---|---|---|---|---|---|---|---|---|---|
2.707 ± 0.016 | 5.363 ± 0.035 |
3.741 ± 0.02 | 3.441 ± 0.019 |
4.476 ± 0.023 | 6.287 ± 0.029 |
5.789 ± 0.027 | 6.371 ± 0.029 |
1.392 ± 0.014 | 4.713 ± 0.025 |
Most of the basic statistics you can see at this page can be downloaded from this CSV file
See this proteome in:

Proteome-pI is available under Creative Commons Attribution-NoDerivs license, for more details see here
| Reference: Kozlowski LP. Proteome-pI 2.0: Proteome Isoelectric Point Database Update. Nucleic Acids Res. 2021, doi: 10.1093/nar/gkab944 | Contact: Lukasz P. Kozlowski |