Cesiribacter andamanensis AMV16
Taxonomy: cellular organisms; Bacteria; FCB group; Bacteroidetes/Chlorobi group; Bacteroidetes; Cytophagia; Cytophagales; Cesiribacteraceae; Cesiribacter; Cesiribacter andamanensis
Average proteome isoelectric point is 6.64
Get precalculated fractions of proteins

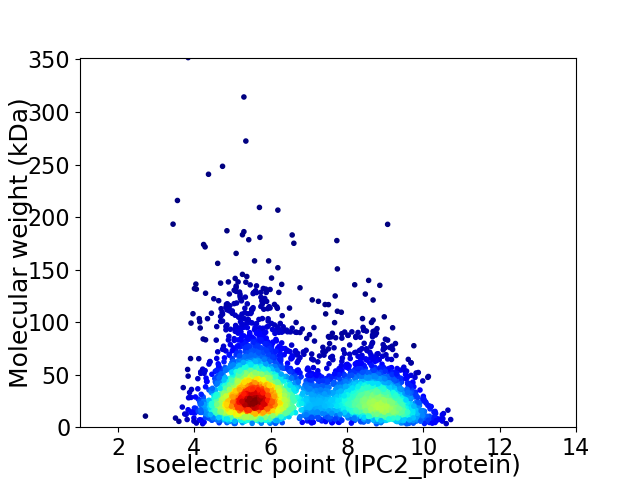
Virtual 2D-PAGE plot for 4225 proteins (isoelectric point calculated using IPC2_protein)
Get csv file with sequences according to given criteria:
* You can choose from 21 different methods for calculating isoelectric point
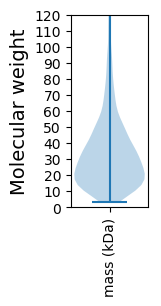
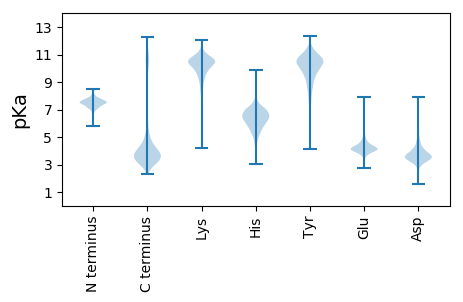
Summary statistics related to proteome-wise predictions


Protein with the lowest isoelectric point:
>tr|M7NGB0|M7NGB0_9BACT Uncharacterized protein OS=Cesiribacter andamanensis AMV16 OX=1279009 GN=ADICEAN_04017 PE=4 SV=1
MM1 pKa = 7.34NSIIRR6 pKa = 11.84KK7 pKa = 9.25SFLFVCLSFGILACKK22 pKa = 10.46DD23 pKa = 3.19DD24 pKa = 4.89DD25 pKa = 4.88APANTPPVFAITSPTDD41 pKa = 3.36AQIEE45 pKa = 4.16AGFVVGQTVQIAGTVTDD62 pKa = 3.66NSEE65 pKa = 3.81VEE67 pKa = 4.48TIVTSIYY74 pKa = 10.99YY75 pKa = 10.42NGFDD79 pKa = 3.41TGQGEE84 pKa = 4.73TIQVGQASYY93 pKa = 10.96SIDD96 pKa = 3.41YY97 pKa = 10.51SVQIPSNAPAGTYY110 pKa = 10.03RR111 pKa = 11.84IVLLATDD118 pKa = 4.85DD119 pKa = 4.15EE120 pKa = 5.03GLTASWDD127 pKa = 3.21KK128 pKa = 10.72TFQVRR133 pKa = 11.84NQQ135 pKa = 3.06
MM1 pKa = 7.34NSIIRR6 pKa = 11.84KK7 pKa = 9.25SFLFVCLSFGILACKK22 pKa = 10.46DD23 pKa = 3.19DD24 pKa = 4.89DD25 pKa = 4.88APANTPPVFAITSPTDD41 pKa = 3.36AQIEE45 pKa = 4.16AGFVVGQTVQIAGTVTDD62 pKa = 3.66NSEE65 pKa = 3.81VEE67 pKa = 4.48TIVTSIYY74 pKa = 10.99YY75 pKa = 10.42NGFDD79 pKa = 3.41TGQGEE84 pKa = 4.73TIQVGQASYY93 pKa = 10.96SIDD96 pKa = 3.41YY97 pKa = 10.51SVQIPSNAPAGTYY110 pKa = 10.03RR111 pKa = 11.84IVLLATDD118 pKa = 4.85DD119 pKa = 4.15EE120 pKa = 5.03GLTASWDD127 pKa = 3.21KK128 pKa = 10.72TFQVRR133 pKa = 11.84NQQ135 pKa = 3.06
Molecular weight: 14.48 kDa
Isoelectric point according different methods:
Protein with the highest isoelectric point:
>tr|M7NYD6|M7NYD6_9BACT DNA binding domain excisionase family OS=Cesiribacter andamanensis AMV16 OX=1279009 GN=ADICEAN_01416 PE=4 SV=1
MM1 pKa = 7.36GLWALVGRR9 pKa = 11.84VALPQGAGNGLYY21 pKa = 9.87IVMSLCRR28 pKa = 11.84AINAVALVQAGIEE41 pKa = 3.89PLRR44 pKa = 11.84RR45 pKa = 11.84VGSGVLAQQHH55 pKa = 4.6VHH57 pKa = 4.94QLVIKK62 pKa = 9.67RR63 pKa = 11.84LGIIRR68 pKa = 11.84TGKK71 pKa = 10.05VSPALAPAAPAMGQAVHH88 pKa = 6.83HH89 pKa = 6.11LPGRR93 pKa = 11.84AFAAQAAIGLGYY105 pKa = 9.79PCFSKK110 pKa = 10.6IFLGQNIGSNLRR122 pKa = 11.84PGLGHH127 pKa = 8.0LYY129 pKa = 9.64PLHH132 pKa = 6.36VKK134 pKa = 10.46NGVAGRR140 pKa = 11.84VADD143 pKa = 3.99GRR145 pKa = 11.84AAAGKK150 pKa = 10.78GEE152 pKa = 4.07MAVGIGLVFSEE163 pKa = 4.79IAANAQAFWLGDD175 pKa = 3.14FGFFHH180 pKa = 7.25KK181 pKa = 10.68NSCGG185 pKa = 3.4
MM1 pKa = 7.36GLWALVGRR9 pKa = 11.84VALPQGAGNGLYY21 pKa = 9.87IVMSLCRR28 pKa = 11.84AINAVALVQAGIEE41 pKa = 3.89PLRR44 pKa = 11.84RR45 pKa = 11.84VGSGVLAQQHH55 pKa = 4.6VHH57 pKa = 4.94QLVIKK62 pKa = 9.67RR63 pKa = 11.84LGIIRR68 pKa = 11.84TGKK71 pKa = 10.05VSPALAPAAPAMGQAVHH88 pKa = 6.83HH89 pKa = 6.11LPGRR93 pKa = 11.84AFAAQAAIGLGYY105 pKa = 9.79PCFSKK110 pKa = 10.6IFLGQNIGSNLRR122 pKa = 11.84PGLGHH127 pKa = 8.0LYY129 pKa = 9.64PLHH132 pKa = 6.36VKK134 pKa = 10.46NGVAGRR140 pKa = 11.84VADD143 pKa = 3.99GRR145 pKa = 11.84AAAGKK150 pKa = 10.78GEE152 pKa = 4.07MAVGIGLVFSEE163 pKa = 4.79IAANAQAFWLGDD175 pKa = 3.14FGFFHH180 pKa = 7.25KK181 pKa = 10.68NSCGG185 pKa = 3.4
Molecular weight: 19.09 kDa
Isoelectric point according different methods:
Peptides (in silico digests for buttom-up proteomics)
Below you can find in silico digests of the whole proteome with Trypsin, Chymotrypsin, Trypsin+LysC, LysN, ArgC proteases suitable for different mass spec machines.| Try ESI |
 |
|---|
| ChTry ESI |
 |
|---|
| ArgC ESI |
 |
|---|
| LysN ESI |
 |
|---|
| TryLysC ESI |
 |
|---|
| Try MALDI |
 |
|---|
| ChTry MALDI |
 |
|---|
| ArgC MALDI |
 |
|---|
| LysN MALDI |
 |
|---|
| TryLysC MALDI |
 |
|---|
| Try LTQ |
 |
|---|
| ChTry LTQ |
 |
|---|
| ArgC LTQ |
 |
|---|
| LysN LTQ |
 |
|---|
| TryLysC LTQ |
 |
|---|
| Try MSlow |
 |
|---|
| ChTry MSlow |
 |
|---|
| ArgC MSlow |
 |
|---|
| LysN MSlow |
 |
|---|
| TryLysC MSlow |
 |
|---|
| Try MShigh |
 |
|---|
| ChTry MShigh |
 |
|---|
| ArgC MShigh |
 |
|---|
| LysN MShigh |
 |
|---|
| TryLysC MShigh |
 |
|---|
General Statistics
Number of major isoforms |
Number of additional isoforms |
Number of all proteins |
Number of amino acids |
Min. Seq. Length |
Max. Seq. Length |
Avg. Seq. Length |
Avg. Mol. Weight |
|---|---|---|---|---|---|---|---|
0 |
1361372 |
29 |
3427 |
322.2 |
36.01 |
Amino acid frequency
Ala |
Cys |
Asp |
Glu |
Phe |
Gly |
His |
Ile |
Lys |
Leu |
|---|---|---|---|---|---|---|---|---|---|
8.708 ± 0.043 | 0.76 ± 0.013 |
4.718 ± 0.029 | 6.36 ± 0.046 |
4.305 ± 0.026 | 7.451 ± 0.04 |
2.139 ± 0.022 | 5.511 ± 0.034 |
4.731 ± 0.04 | 11.34 ± 0.051 |
Met |
Asn |
Gln |
Pro |
Arg |
Ser |
Thr |
Val |
Trp |
Tyr |
|---|---|---|---|---|---|---|---|---|---|
2.254 ± 0.018 | 3.842 ± 0.033 |
4.616 ± 0.026 | 5.106 ± 0.033 |
5.54 ± 0.034 | 6.079 ± 0.038 |
5.183 ± 0.04 | 6.178 ± 0.028 |
1.332 ± 0.015 | 3.846 ± 0.027 |
Most of the basic statistics you can see at this page can be downloaded from this CSV file
Proteome-pI is available under Creative Commons Attribution-NoDerivs license, for more details see here
| Reference: Kozlowski LP. Proteome-pI 2.0: Proteome Isoelectric Point Database Update. Nucleic Acids Res. 2021, doi: 10.1093/nar/gkab944 | Contact: Lukasz P. Kozlowski |
